
How Bitcoin ETF Inflows and Outflows Impact BTC Price in 2026: Risks, Opportunities, and What Traders Should Watch
2026/05/22 15:48:02
Introduction
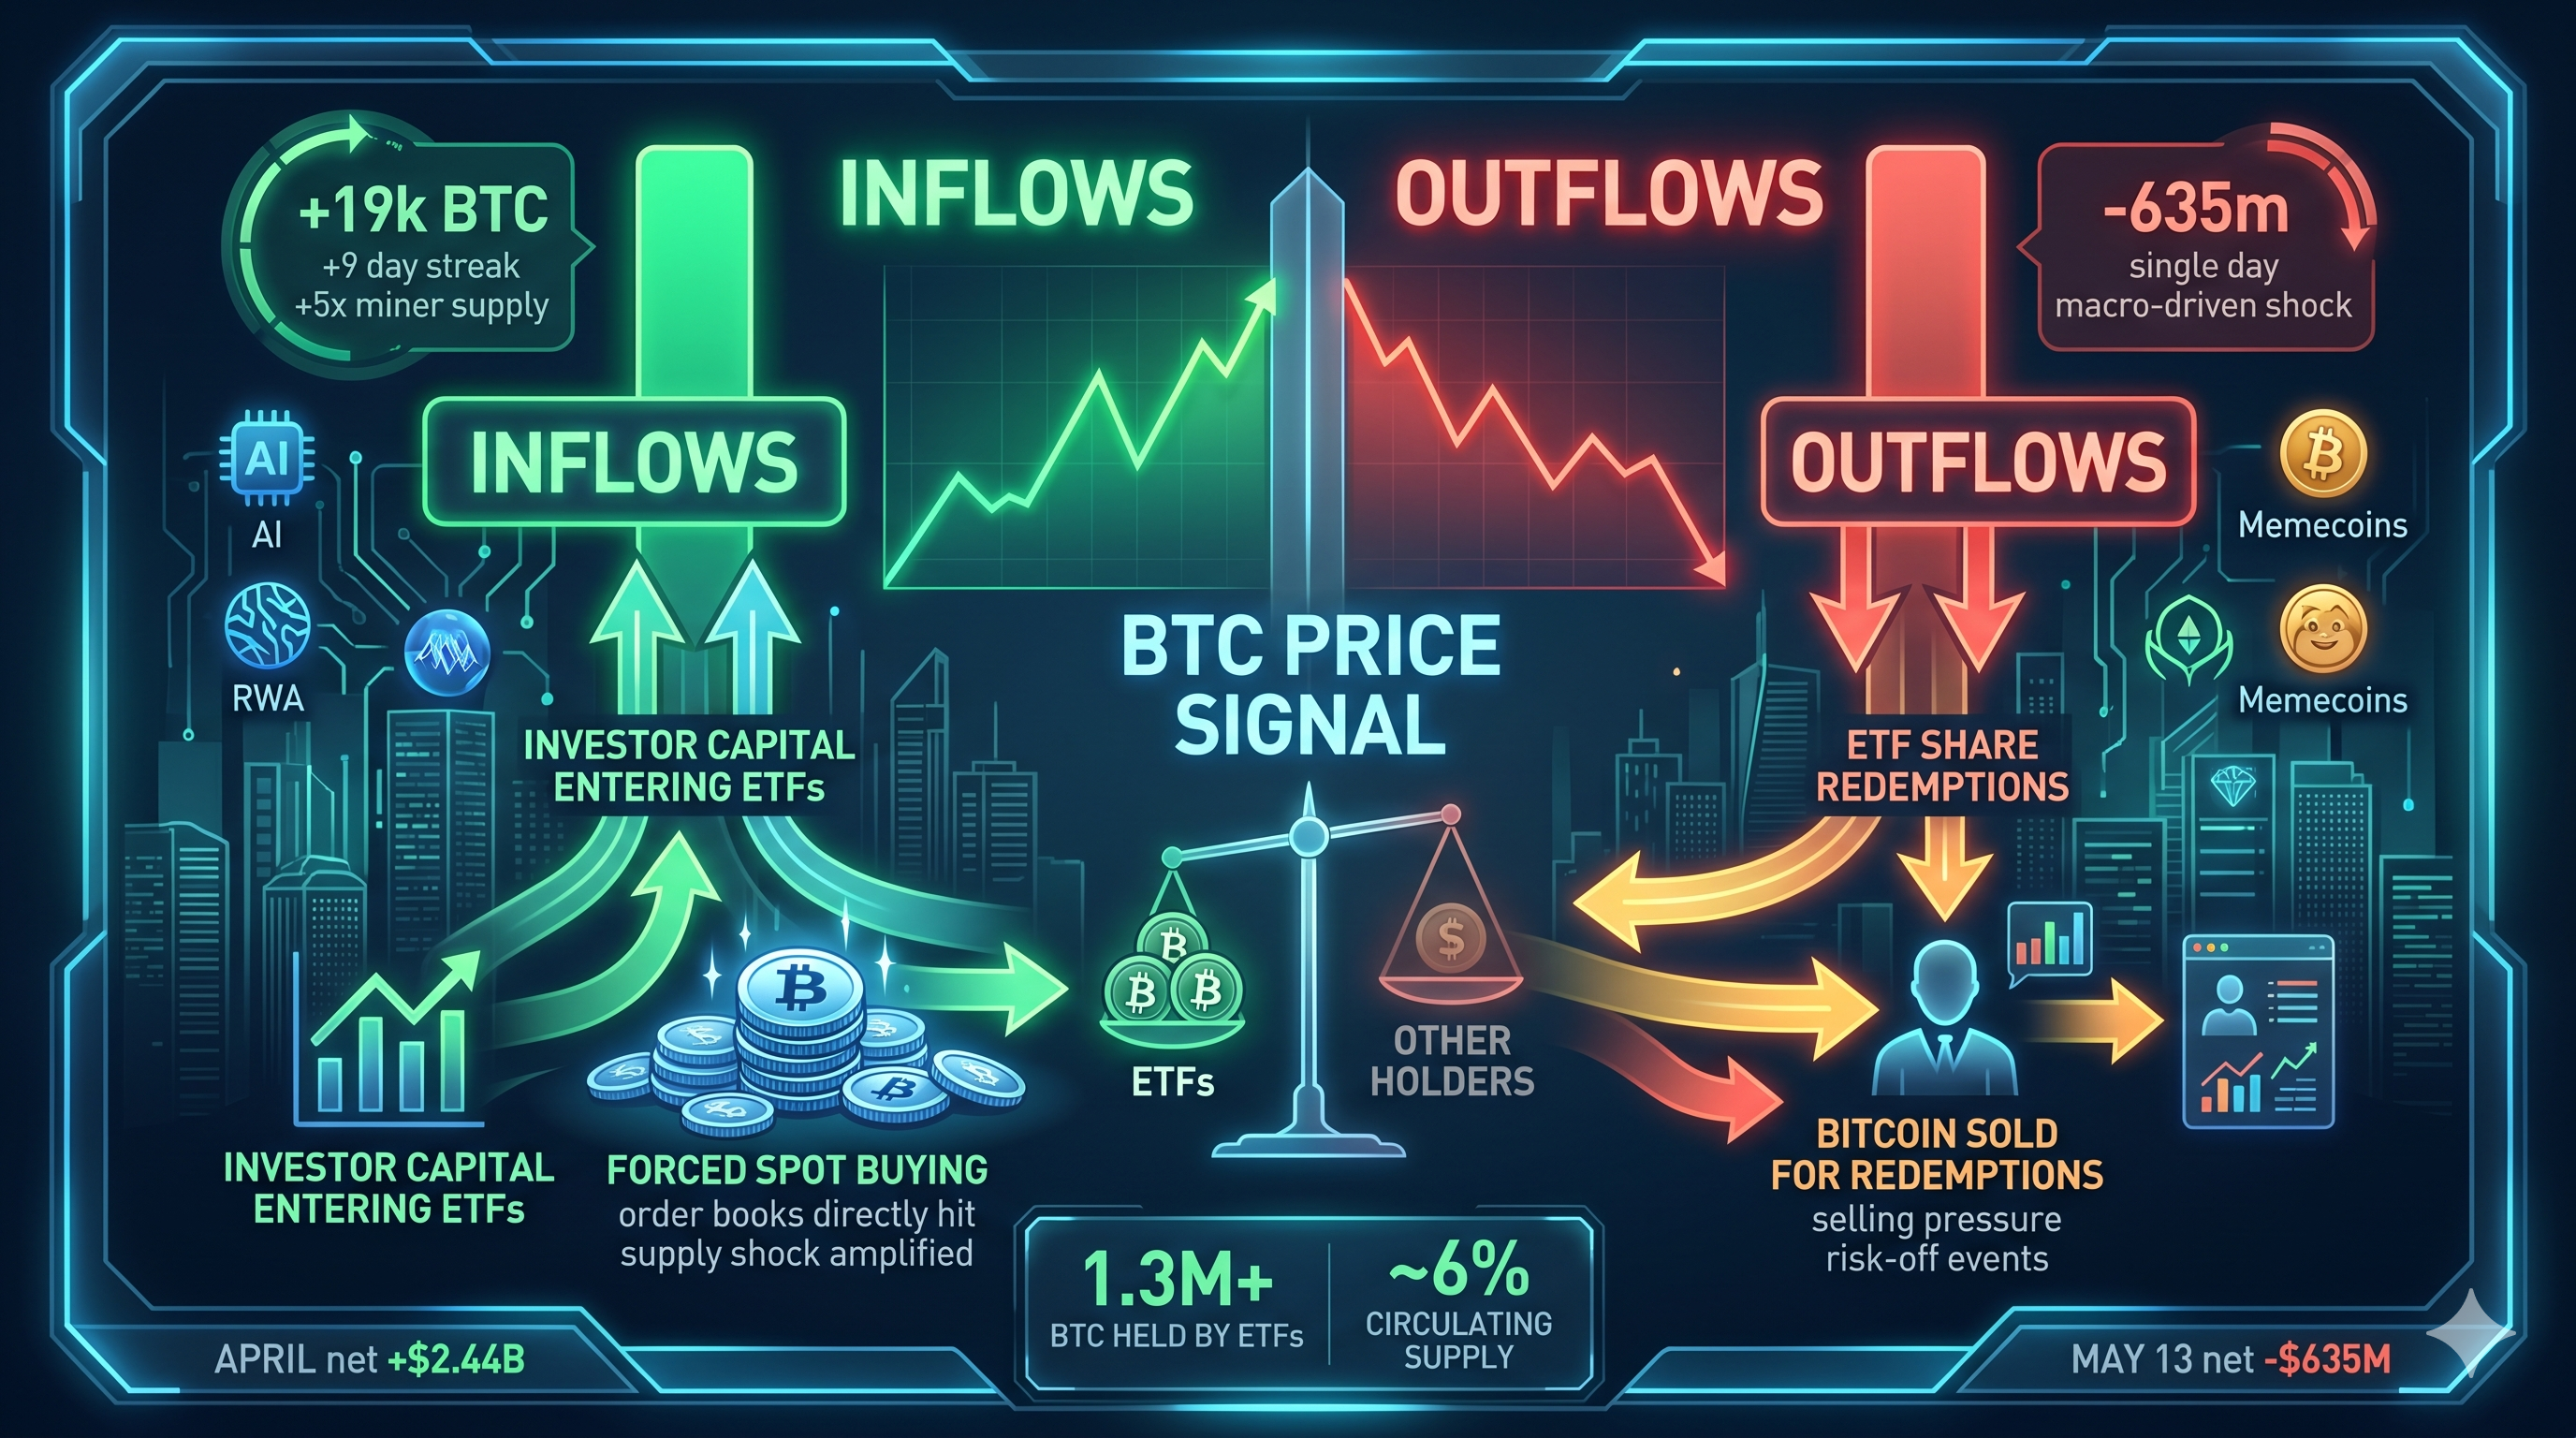
Did you know that U.S. spot Bitcoin ETFs now collectively hold more BTC than Satoshi Nakamoto's estimated stash? U.S. spot Bitcoin ETFs now collectively hold approximately 1.3 million BTC, making them one of the single largest holders of Bitcoin globally. That concentration is exactly why ETF flow data has become the most important short-term price signal in crypto.
Bitcoin ETF inflows push BTC price higher because authorized participants must buy actual BTC on the open market to create new shares; outflows do the opposite by forcing redemptions and on-chain selling. In 2026, this mechanical link has tightened — institutional flows now move price more reliably than halving cycles or retail sentiment. This article breaks down how the flows work, what the latest 2026 data reveals, and where the real risks and opportunities lie for traders chasing hyped tokens on the back of ETF narratives.
What Are Bitcoin ETF Inflows and Outflows?
Bitcoin ETF inflows and outflows measure the net daily movement of investor capital in and out of spot Bitcoin exchange-traded funds. Bitcoin ETF outflows occur when investors redeem their shares, prompting the fund to sell Bitcoin to return capital. The opposite — inflows — happens when new money enters the fund, requiring the purchase of additional BTC.
The bitcoin ETF net flow on any given day is the sum of all buying and selling activity across every U.S.-listed spot Bitcoin ETF product. That includes BlackRock's IBIT, Fidelity's FBTC, Bitwise's BITB, Ark/21Shares' ARKB, Grayscale's GBTC, and several smaller issuers.
Why ETF Flows Are Different From Trading Volume
ETF flows reflect actual position-taking, not just turnover. AUM (assets under management) is the total dollar value of Bitcoin held across all spot ETF products. Net flows measure the daily difference between new money entering and existing money leaving. AUM can increase even on outflow days if BTC price rises enough to offset redemptions, which is why net flow data gives a cleaner read on actual investor behavior than AUM alone.
For traders, this means net flow is the cleanest proxy for institutional conviction on any given day.
How Do Bitcoin ETF Flows Directly Move BTC Price?
ETF flows move BTC price through forced spot-market buying or selling by authorized participants. When inflows arrive, market makers must source real Bitcoin on exchanges to mint new ETF shares — that demand hits the order book directly. When outflows occur, the reverse happens: real BTC is sold to honor redemptions.
The 2026 supply math makes this transmission mechanism unusually powerful. In April 2026, U.S. spot Bitcoin ETFs absorbed approximately 19,000 BTC over a nine-day streak, nine times the amount of new Bitcoin mined in that same period. When institutional buyers absorb nine times the daily new supply through a single product category, the market structure changes fundamentally. Less coin sits on exchanges. The float shrinks. Small increases in demand move price disproportionately.
The Supply-Shock Math
The imbalance between ETF demand and miner supply is structural rather than seasonal. The combined buying pressure from ETFs and Strategy creates a supply dynamic worth quantifying. At the current post-halving block reward of 3.125 BTC every ten minutes, miners produce roughly 13,500 new BTC per month. ETF and Strategy purchases in April absorbed the equivalent of six to seven months of new miner supply in 30 days. This is the structural argument that keeps the "supply shock" narrative alive. Even if you discount the most aggressive projections, the math is simple. Demand from just two buyer categories exceeded new supply by a factor of roughly 5x in April alone.
That is why even modest sustained inflows now translate into outsized price moves.
What Do the Latest 2026 Bitcoin ETF Flow Numbers Show?
The latest data through May 2026 shows a market caught between strong institutional accumulation and sharp macro-driven outflow days. U.S. spot Bitcoin ETFs pulled $2.44 billion in net inflows during April, nearly doubling March's $1.32 billion. This made April the strongest month for BTC ETF flows in 2026 and the best single month since October 2025. BlackRock's iShares Bitcoin Trust (IBIT) captured $1.71 billion of the $2.44 billion total, roughly 70% market share. Fidelity's FBTC came in second with $213.4 million, and the remaining funds split about $516 million.
The momentum carried into early May. Based on Farside Investors data cited by MEXC, spot Bitcoin exchange-traded funds attracted approximately $1.1 Billion across two trading sessions, according to data from Farside Investors. The inflows coincided with Bitcoin trading above $80,000, marking its highest level since January.
Total Holdings and Market Share
The cumulative footprint of spot ETFs has become impossible to ignore. According to Analytics Insight's May 2026 outlook, spot Bitcoin ETFs now manage more than $102 billion in total assets. These ETF products also hold over 1.3 million BTC. BlackRock's Bitcoin ETF remains the largest product in the market. Reports show that BlackRock controls nearly 60% of the total spot Bitcoin ETF market.
Per May 2026 data, spot Bitcoin ETFs in the United States collectively hold approximately 1.3 million BTC, which represents 6% to 7% of Bitcoin's circulating supply.
| Metric (as of May 2026) | Value |
| Total spot BTC ETF AUM | ~$102 billion |
| Total BTC held by U.S. spot ETFs | ~1.3 million BTC |
| Share of circulating BTC supply | 6%–7% |
| BlackRock IBIT market share | ~60%–70% |
| April 2026 net inflows | $2.44 billion |
| Largest single-day outflow (May 13, 2026) | $635 million |
Why Do Outflows Sometimes Hit Even During Bullish Periods?
Outflows typically cluster around macro events — FOMC meetings, CPI prints, and geopolitical shocks — even when the longer-term trend remains bullish. The inflow streak ended on April 28 when $137.77 million in net outflows hit the day before the FOMC meeting. Over the next three days, a total of $490 million flowed out as traders de-risked ahead of Powell's press conference.
This pattern is now predictable. Why did Bitcoin ETF outflows spike after the FOMC meeting? Traders typically de-risk ahead of Federal Reserve announcements, creating a sell-the-news pattern that has repeated at nearly every FOMC meeting since 2024. April's outflows totaled $490 million over three days but reversed quickly, with modest inflows returning on May 1.
The May 13, 2026 outflow event was even sharper. According to Bitcoin Foundation reporting on SoSoValue data, analysts attribute the sharp outflow to macroeconomic factors. The Consumer Price Index (CPI) rose to 3.8% in April, the highest since September 2023. The Producer Price Index (PPI) jumped to 6%. These data points heightened concerns about tight Fed policy and pushed back expectations for rate cuts. Corporate bitcoin (BTC) purchases also slowed significantly, down 80% compared to the previous month. Institutional investors used the price recovery to partially take profits.
The Geopolitical Channel
ETF flows also respond to risk-off events. The macro backdrop in 2026 has been defined by US-Iran tensions and volatile oil prices. Rather than crushing Bitcoin as previous macro shocks did, this conflict has done something more interesting. Bitcoin is navigating this environment differently from prior cycles. The geopolitical backdrop contributed directly to increased macro-hedge bids for both Bitcoin and Ethereum.
What Are the Opportunities for Hyped Tokens From Bitcoin ETF Flows?
Strong Bitcoin ETF inflows create a clear spillover opportunity for hyped altcoins and momentum tokens. When BTC rallies on institutional flows, liquidity rotates down the risk curve — first into ETH and major large caps, then into memecoins, AI tokens, and other narrative-driven assets.
Three Concrete Opportunity Channels
-
The wealth-effect rotation. When ETF buyers push BTC to new local highs, existing crypto-native holders take profits and redeploy into higher-beta tokens. Hyped tokens — those riding active narratives like RWA, AI agents, or new L2 launches — tend to outperform BTC during the second leg of any ETF-driven rally.
-
The legitimacy halo. Spot Bitcoin ETF inflows matter because they show how much capital is entering Bitcoin through regulated traditional finance channels. These products are used by brokerage clients, wealth managers, institutions and investors who may not want to hold Bitcoin directly on crypto exchanges. Consistent inflows can support market confidence because they suggest Bitcoin is being accumulated by longer-term investors. That institutional validation often pulls retail attention back into smaller, more speculative tokens.
-
The supply-shock tailwind. With ETFs absorbing 5x to 9x daily miner issuance, the float available for active trading shrinks. The same effect — concentrated holders and thin float — applies to many hyped tokens after a strong listing or unlock cliff, amplifying upside when capital rotates in.
What Are the Risks for Hyped Tokens When ETF Outflows Hit?
The biggest risk for hyped tokens is that ETF outflows trigger sharper drawdowns in altcoins than in BTC itself. When institutional capital exits through the ETF wrapper, crypto-native traders front-run the move by dumping high-beta positions first. Hyped tokens — with thinner liquidity and weaker fundamentals than BTC — often fall 2x to 4x as hard.
Four Risks Every Hype-Token Trader Must Price In
-
Correlation spikes during stress. When ETF outflows accelerate, almost every crypto asset moves in the same direction. Diversification across altcoins offers little protection.
-
Liquidity evaporates first in small caps. A $500 million ETF outflow day can flush 20%–30% from a hyped microcap before BTC even drops 3%.
-
Narrative fragility. Hyped tokens depend on continued attention. When ETF flows turn negative for a sustained week, crypto media coverage shifts to bearish framing, starving narrative tokens of inflows.
-
Macro overrides everything. Per the May 13, 2026 outflow data, even strong fundamentals could not protect prices once CPI and PPI surprised to the upside. Hyped tokens with no cash flows have nothing to fall back on when macro turns.
The Underperformance Risk in 2026
Despite the April surge, 2026 inflows have been uneven. Even BlackRock's flagship product reflects the choppy tape — IBIT's NAV as of May 20, 2026 was $43.89, with a 52-week range of $36.23 to $71.32, and a YTD total return of -11.37%. That drawdown happened despite billions in net inflows, proving that flows alone do not guarantee price appreciation when macro headwinds dominate.
How to Read Bitcoin ETF Flow Data as a Trading Signal
Read flow data in three layers: daily prints for tactical entries, weekly trends for positioning, and monthly net flows for regime identification. A single day of outflows is noise; five consecutive days is signal.
According to Zipmex's February 2026 analysis, as of the most recent data (Feb 27, 2026), spot Bitcoin ETFs recorded a modest $27.8 million net outflow, following three consecutive days of strong inflows totaling approximately $1.1 billion. The weekly total remains net positive at roughly $815 million.
The confirmation framework is straightforward: the confirmation signal going forward is simple. If daily net flows stay positive through the end of April, the institutional bid is real and BTC has a floor under it that did not exist in March.
Three Signals That Matter Most
-
Concentration check: When IBIT alone accounts for 70%+ of daily inflows, the rally is narrow and more vulnerable to a single-issuer reversal.
-
Streak length: Five or more consecutive inflow days has historically marked durable bottoms in 2026.
-
Macro overlay: Always cross-reference flow data with the FOMC calendar and CPI release dates.
Conclusion
Bitcoin ETF inflows and outflows have become the single most reliable short-term driver of BTC price in 2026. With spot ETFs now holding 6%–7% of circulating supply and absorbing multiples of monthly miner issuance, every billion dollars of net flow ripples directly into spot prices — and through the rest of the crypto market.
For traders, the playbook is clear. Sustained inflow streaks confirm institutional conviction and create the cleanest setup for both BTC longs and rotational plays into hyped tokens. Macro-driven outflow events — FOMC meetings, hot CPI prints, geopolitical shocks — create sharp downside risk that hits altcoins twice as hard as BTC.
The opportunity in hyped tokens is real but narrow: trade them only when ETF flows confirm the regime, and exit before the next macro catalyst. The risk is that correlations spike during stress, liquidity evaporates first in small caps, and narratives die fast when institutional flows turn negative.
Watch the daily flow data, weigh it against the macro calendar, and let the prints guide your positioning rather than your conviction.
FAQs
-
How quickly do Bitcoin ETF flows affect BTC price?
ETF flow data is published with a one-day lag, but the underlying buying or selling typically hits spot markets the same day shares are created or redeemed. Price impact is often visible within hours of large flow events, though the headline data only confirms what order books already showed.
-
Can ETF outflows alone cause a Bitcoin bear market?
No — outflows are usually a symptom rather than a cause. Sustained outflows tend to follow macro shocks like hot inflation prints or geopolitical escalation, which would have pressured BTC regardless of the ETF wrapper. ETFs amplify both directions but do not independently dictate trend.
-
Why does BlackRock's IBIT dominate ETF flow data?
IBIT benefits from BlackRock's massive distribution network, lower fees relative to legacy products, and first-mover scale that attracted early institutional allocators. Once liquidity concentrates in one product, brokers and advisors default to it, creating a self-reinforcing dominance loop.
-
Should hyped-token traders care about Bitcoin ETF flows?
Yes — ETF flows determine the macro liquidity regime for the entire crypto market. Strong sustained inflows pull capital down the risk curve into altcoins and hyped tokens; sustained outflows do the reverse, often with 2x to 4x sharper downside in small caps.
-
What is the best free source for tracking Bitcoin ETF flows daily?
Farside Investors, SoSoValue, and CoinGlass all publish free daily net flow data broken down by issuer. For deeper context, The Block's ETF dashboard tracks both individual fund flows and aggregate totals across all U.S.-listed spot BTC products.