

Bitcoin Trades Below Short-Term Holder Cost Basis for Over 9 Months: Ongoing Bear Market Signals and What It Means for BTC
2026/07/18 11:12:00
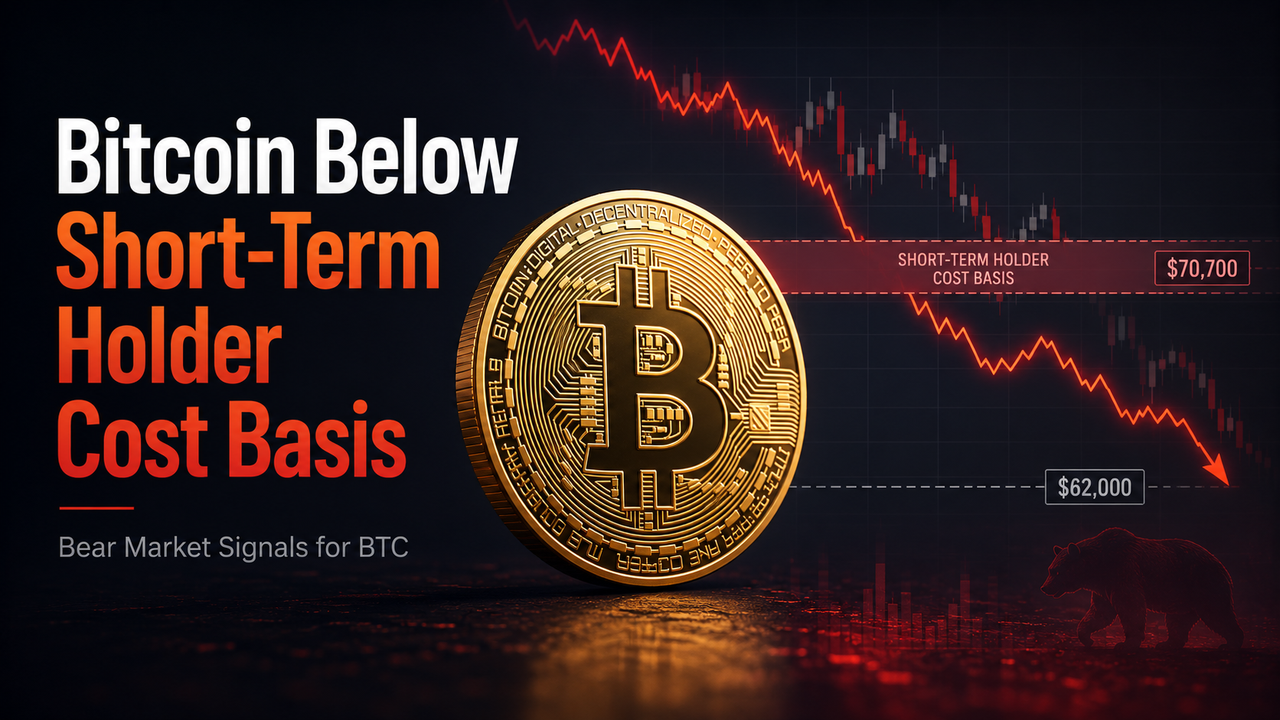
Bitcoin’s continued position below the average acquisition price of recent buyers has become an important on-chain signal for the current market cycle. According to CryptoQuant contributor Darkfost, BTC has remained below the short-term holder cost basis for more than nine months, with the level estimated near $70,700.
Based on the Bitcoin live price and market overview, BTC was trading around $62,000 on July 14, 2026, leaving many recent buyers at an unrealized loss and potentially contributing to selling pressure during recovery attempts. Glassnode places the cost basis slightly higher at approximately $72,200 and reports a shorter period of about five months below the metric and the True Market Mean. These differences reflect variations in calculation methods and holder classifications. Although trading below the cost basis does not guarantee further price declines, it suggests that Bitcoin has not yet established a sustained recovery strong enough to return recent investors to profit.
Bitcoin Remains Below the Short-Term Holder Cost Basis for More Than Nine Months
Bitcoin’s prolonged position below the short-term holder cost basis has become an important on-chain signal for assessing market strength. According to analysis attributed to CryptoQuant contributor Darkfost, BTC has remained under this level for more than nine months, suggesting that many recent buyers continue to hold coins at an unrealized loss. While the metric does not independently confirm that prices must fall further, it helps explain why recovery attempts may face resistance and why investor confidence has remained fragile.
-
What the Short-Term Holder Cost Basis Shows
The short-term holder cost basis estimates the average purchase price of Bitcoin owned by market participants who acquired their coins relatively recently. These investors are generally considered more sensitive to volatility than long-term holders because they have had less time to build conviction or absorb major price swings. When Bitcoin trades above their average cost, newer participants are collectively in profit, which can support stronger sentiment and encourage continued holding. When BTC remains below the metric, the average recent buyer is instead holding an unrealized loss. This can weaken confidence, especially during periods when rallies fail to recover important technical and on-chain levels. Investors who have spent months underwater may also become more willing to sell when Bitcoin approaches their original entry price, creating additional supply near the cost-basis threshold.
The main implications include:
-
Recent buyers remain under financial pressure.
-
Rebounds may attract selling near breakeven levels.
-
New demand may be insufficient to absorb available supply.
-
Market sentiment can remain cautious despite temporary price recoveries.
-
The $70,700 Region Has Become an Important Resistance Zone
The CryptoQuant-linked estimate places the short-term holder cost basis near $70,700, significantly above Bitcoin’s recent trading range. This gap shows that BTC would need a meaningful recovery before the average short-term holder returns to profit. More importantly, the metric may act as a psychological and on-chain resistance level because investors who bought at higher prices could use a rally toward the region to reduce their exposure.
Resistance around the cost basis does not mean Bitcoin cannot eventually move above it. However, a brief intraday breakout would provide less confirmation than a sustained move supported by stronger spot demand, improving trading volume and reduced selling pressure. The market would likely need to establish the level as support before the signal could be interpreted as evidence of a more durable trend change. The broader $69,000–$72,000 region may therefore be more useful than focusing on one exact price. Cost-basis estimates can vary slightly between data providers because of differences in holder definitions, entity adjustments and calculation methods.
-
The May Rally Failed to Produce a Lasting Trend Reversal
Bitcoin’s rally toward $82,000 in May briefly improved conditions for short-term holders, but the move was followed by a sharp rejection. The failure to maintain higher prices suggested that buying demand was not strong enough to absorb selling pressure and establish a stable recovery above key on-chain thresholds. This rejection was important because a successful reclaim of the short-term holder cost basis could have shifted more recent investors back into profit. Instead, the decline pushed many of these holders underwater again and reinforced the cost basis as overhead resistance. It also demonstrated that crossing the level temporarily is not sufficient on its own; the market must remain above it long enough to change investor behaviour and improve confidence.
The failed rally does not rule out another recovery attempt. It does, however, indicate that Bitcoin may need stronger liquidity, sustained institutional demand and broader improvement in market conditions before a bullish breakout becomes more convincing.
-
Lower-Price Accumulation Is Gradually Reducing the Cost Basis
The short-term holder cost basis can move lower when investors continue purchasing Bitcoin at reduced prices. As newer coins are acquired below previous market levels, the average entry price of the short-term holder group gradually declines. This process can reduce the distance Bitcoin must recover before reaching the metric again.
A falling cost basis has two possible interpretations. On one hand, it may show that buyers are accumulating BTC during weakness and building positions at more attractive prices. This could eventually create a stronger foundation if selling pressure declines and demand improves. On the other hand, the metric may continue falling because the market remains weak and new investors are entering at progressively lower levels. The direction of the cost basis should therefore be evaluated alongside other indicators, including spot trading volume, exchange inflows, realized losses, ETF flows and long-term holder activity. No single metric can fully explain Bitcoin bull runs and crypto market cycles.
-
What Bitcoin Would Need to Show Before Conditions Improve
A sustained recovery above the short-term holder cost basis would be an encouraging development because it would place the average recent buyer back into profit. This could reduce pressure from investors waiting to exit near breakeven and potentially strengthen market confidence. However, the quality of the recovery would depend on whether Bitcoin can remain above the level rather than merely crossing it during a short-lived rally.
Investors may watch for several signs of improvement:
-
BTC closes consistently above the $69,000–$72,000 resistance region.
-
The former cost-basis resistance begins functioning as support.
-
Spot-market demand increases rather than relying mainly on leverage.
-
Realized losses among short-term holders begin to decline.
-
Market rallies are supported by stronger volume and healthier liquidity.
Until those conditions emerge, Bitcoin’s position below the short-term holder cost basis may continue to reflect a cautious market environment. The metric should be treated as a useful indicator of investor profitability and resistance rather than a guarantee that BTC will either decline further or immediately begin a new bullish cycle.
Short-Term Holder Cost Basis Signals for Bitcoin’s Bear Market and BTC Price Outlook
Bitcoin’s relationship with the short-term holder cost basis can help investors judge whether a rebound reflects temporary volatility or a broader change in market structure. The metric does not predict Bitcoin’s exact price direction, but it provides useful insight into recent investor profitability, overhead selling pressure and the strength of any potential recovery.
-
Prolonged Trading Below the Cost Basis Signals Continued Market Weakness
When Bitcoin remains below the short-term holder cost basis for several months, it suggests that many recent buyers are holding unrealized losses. This can reduce market confidence, weaken risk appetite and make investors more cautious about buying during rallies. While short periods below the threshold can occur during ordinary corrections, prolonged weakness may indicate a deeper adjustment in liquidity, demand and investor sentiment. This does not mean BTC must decline continuously. Bearish market phases often include sharp relief rallies and periods of consolidation. However, repeated failures to remain above the cost basis may show that sellers still control the recovery zone. Underwater holders may sell as Bitcoin approaches their breakeven prices, increasing available supply and limiting upward momentum.
-
Bitcoin Must Reclaim and Hold the Cost Basis to Strengthen the Recovery Outlook
The distance between Bitcoin’s market price and the short-term holder cost basis helps show how difficult the recovery may be. A smaller gap suggests that recent investors are close to returning to profit, while a wider gap means BTC may need stronger demand to reach the threshold. The gap can also narrow because the cost basis falls as investors accumulate at lower prices, but this does not carry the same bullish signal as a price-led recovery supported by rising spot demand.
A move above the cost basis would be an encouraging early signal, but it would not automatically confirm a new Bitcoin bull market. A more convincing recovery would require BTC to remain above the threshold, successfully retest it as support and continue forming higher highs and higher lows. Stronger spot volume, improving ETF flows and declining realized losses would provide additional confirmation that the bearish market structure is weakening.
-
The Cost-Basis Signal Should Be Combined With Other Bitcoin Market Indicators
The short-term holder cost basis is useful because it connects Bitcoin’s price with the profitability of recent market participants, but it should not be used alone. BTC also responds to institutional demand, derivatives positioning, exchange balances, interest-rate expectations, regulatory developments and broader global liquidity conditions.
Investors may therefore combine the metric with:
-
Spot-market trading volume and liquidity
-
Bitcoin ETF inflows and outflows
-
Realized profits and losses
-
Long-term holder accumulation
-
Exchange inflows and available supply
When several indicators improve alongside a sustained cost-basis reclaim, the case for a broader Bitcoin recovery becomes stronger. Continued rejection, weak spot demand or the loss of major support levels may instead keep BTC vulnerable to consolidation and further volatility.
Why CryptoQuant and Glassnode Report Different Cost-Basis Readings
On-chain analytics providers use different methods to classify wallets, entities and holding periods, so their reported short-term holder cost-basis levels and durations may vary.
-
CryptoQuant-linked estimate: Bitcoin remained below the short-term holder cost basis for more than nine months, with the threshold near $70,700.
-
Glassnode estimate: Its July 8 analysis placed the cost basis near $72,200 and said BTC had remained below this level and the True Market Mean for about five months.
-
Methodology differences: Providers may group wallets differently, exclude certain entities, use different holder-age definitions and treat brief moves above the cost basis in different ways.
-
Practical interpretation: Rather than relying on one exact figure, investors may view the $69,000–$72,200 region as a broader resistance zone where many recent buyers could return toward breakeven.
Key Bitcoin Levels and Conditions That Could Improve the Market Outlook
Bitcoin’s current on-chain structure highlights several important support and resistance zones, along with broader market conditions that could influence the strength of any recovery. These levels should be treated as ranges rather than exact reversal points because BTC can temporarily move above or below them before returning to its previous trading area.
Bitcoin Support and Resistance Levels to Watch
The $60,000 region remains an important psychological and technical support area. Bitcoin recently rebounded after falling into the high-$50,000 range, showing that buyers have been willing to enter at lower prices. However, repeated tests could weaken this support if each recovery attracts less demand. If BTC loses this area, deeper on-chain support may emerge near $53,000–$53,600, where Bitcoin’s broader realized price and a possible lower bear-market boundary are located.
On the upside, initial resistance is concentrated between $66,800 and $70,700, where many short-term holders purchased BTC and may sell as prices return toward their entry levels. The short-term holder cost basis near $71,400–$72,200 represents the next major recovery threshold. A sustained move above this zone could return many recent buyers to profit, while the True Market Mean near $76,600–$77,000 may serve as a higher structural resistance area.
Market Conditions That Could Support a Stronger BTC Recovery
A healthier Bitcoin recovery would likely require stronger spot-market buying rather than a rally driven mainly by leveraged futures positions. Understanding how crypto futures trading works helps clarify why leverage-driven price moves may be more vulnerable to liquidations and sudden reversals than rallies supported by direct spot demand. Rising spot volume could show that buyers are absorbing supply from investors selling near breakeven, making the move potentially more sustainable.
Improving Bitcoin ETF flows could also strengthen institutional demand. Several weeks of neutral or positive flows would provide more meaningful evidence than a single day of inflows. At the same time, declining realized losses among short- and long-term holders could suggest that capitulation pressure is easing and fewer investors are selling below their acquisition prices. Macroeconomic conditions will also remain important. Lower interest-rate expectations, improving global liquidity and a weaker U.S. dollar could support demand for Bitcoin and other risk assets. Higher yields, a stronger dollar or renewed geopolitical uncertainty may instead keep investors cautious and limit the strength of any recovery.
Conclusion
Bitcoin’s continued position below the short-term holder cost basis suggests that the market has not yet confirmed a full recovery. CryptoQuant-linked analysis places the level near $70,700, while Glassnode estimates it closer to $72,200, creating a broad resistance zone where recent buyers may sell near breakeven. Weak ETF flows, elevated realized losses and limited institutional activity still point to caution, although accumulation at lower prices and demand below $60,000 provide some support. A stronger outlook would likely require BTC to reclaim the cost-basis region, hold it as support and attract more consistent spot demand.
FAQs
Why Are Bitcoin Short-Term Holders Commonly Classified Using 155 Days?
The 155-day threshold is based on historical Bitcoin spending behaviour. Glassnode found that coins held beyond roughly five months become increasingly less likely to move, making 155 days a useful dividing point between more active short-term participants and longer-term holders. It is a statistical classification rather than a fixed rule followed by every investor or analytics provider.
Does Transferring Bitcoin Between Personal Wallets Change Its Holder Classification?
A standard on-chain model may treat a transferred Bitcoin output as newly moved, potentially resetting its coin age. However, entity-adjusted analytics attempt to identify addresses controlled by the same owner and filter out self-transfers or internal wallet reshuffling. These methods can improve accuracy, but wallet ownership cannot always be identified perfectly from public blockchain data.
Is the Short-Term Holder Cost Basis the Same as the Average Bitcoin Purchase Price on an Exchange?
No. The short-term holder's cost basis values coins according to the price when they last moved on-chain, while an exchange account calculates an investor’s average entry price from actual trades recorded on that platform. BTC can change hands several times within an exchange without producing a visible blockchain transaction, so the two figures may differ considerably.
Does Trading Below the Cost Basis Mean Short-Term Holders Have Already Lost Money?
Not necessarily. A market price below the cost basis represents an unrealized loss for the average short-term holder. The loss generally becomes realized only when coins are transferred or sold below their estimated acquisition value. Some investors may continue holding until conditions improve, while others may sell to reduce risk or free capital for other investments.
What Is the Difference Between Short-Term Holder Cost Basis and STH-MVRV?
The cost basis estimates the average acquisition level of recent Bitcoin supply, while STH-MVRV compares the current market value of that supply with its realized value. An STH-MVRV reading below 1 generally indicates that short-term holders are collectively underwater, whereas a reading above 1 suggests aggregate unrealized profit. The ratio can help show the scale of profitability or financial stress rather than only the breakeven price.
How Is the Short-Term Holder Cost Basis Different From STH-SOPR?
The cost basis measures the estimated average price paid by short-term holders, while the Spent Output Profit Ratio, or SOPR, examines whether coins being moved are realizing profits or losses. Cost basis describes the position of the wider holder group, whereas SOPR focuses on the behaviour of coins that are actually being spent during a particular period.
Can the Short-Term Holder Cost Basis Change When Bitcoin’s Price Remains Stable?
Yes. The metric can move even when BTC trades within a narrow range because its composition changes as coins are bought, transferred or age beyond the short-term holder window. Large amounts of lower-priced supply entering the cohort may pull the cost basis down, while higher-priced coins entering it may push the average upward. The metric therefore reflects both market price and changing on-chain ownership behaviour.
Are Bitcoin ETF and Centralized Exchange Trades Fully Reflected in the Cost-Basis Metric?
Not fully. Bitcoin ETF activity may eventually create visible custody transfers, but the ownership of individual ETF shares is not recorded directly on the Bitcoin blockchain. Similarly, trades completed inside centralized exchanges can occur within internal databases without moving BTC on-chain. The short-term holder cost basis is therefore a valuable market estimate, but it should not be treated as a complete record of every investor’s purchase price.
Disclaimer
The information provided on this page may originate from third-party sources and does not necessarily represent the views or opinions of KuCoin. This content is intended solely for general informational purposes and should not be considered financial, investment, or professional advice. KuCoin does not guarantee the accuracy, completeness, or reliability of the information, and is not responsible for any errors, omissions, or outcomes resulting from its use. Investing in digital assets carries inherent risks. Please carefully evaluate your risk tolerance and financial situation before making any investment decisions. For further details, please consult KuCoin’s Terms of Use and Risk Disclosure.