
US PPI Data Beats Expectations: Bitcoin Drops Below $80K, Solana Falls 4% on Rate-Cut Repricing
2026/05/14 14:03:02
Introduction
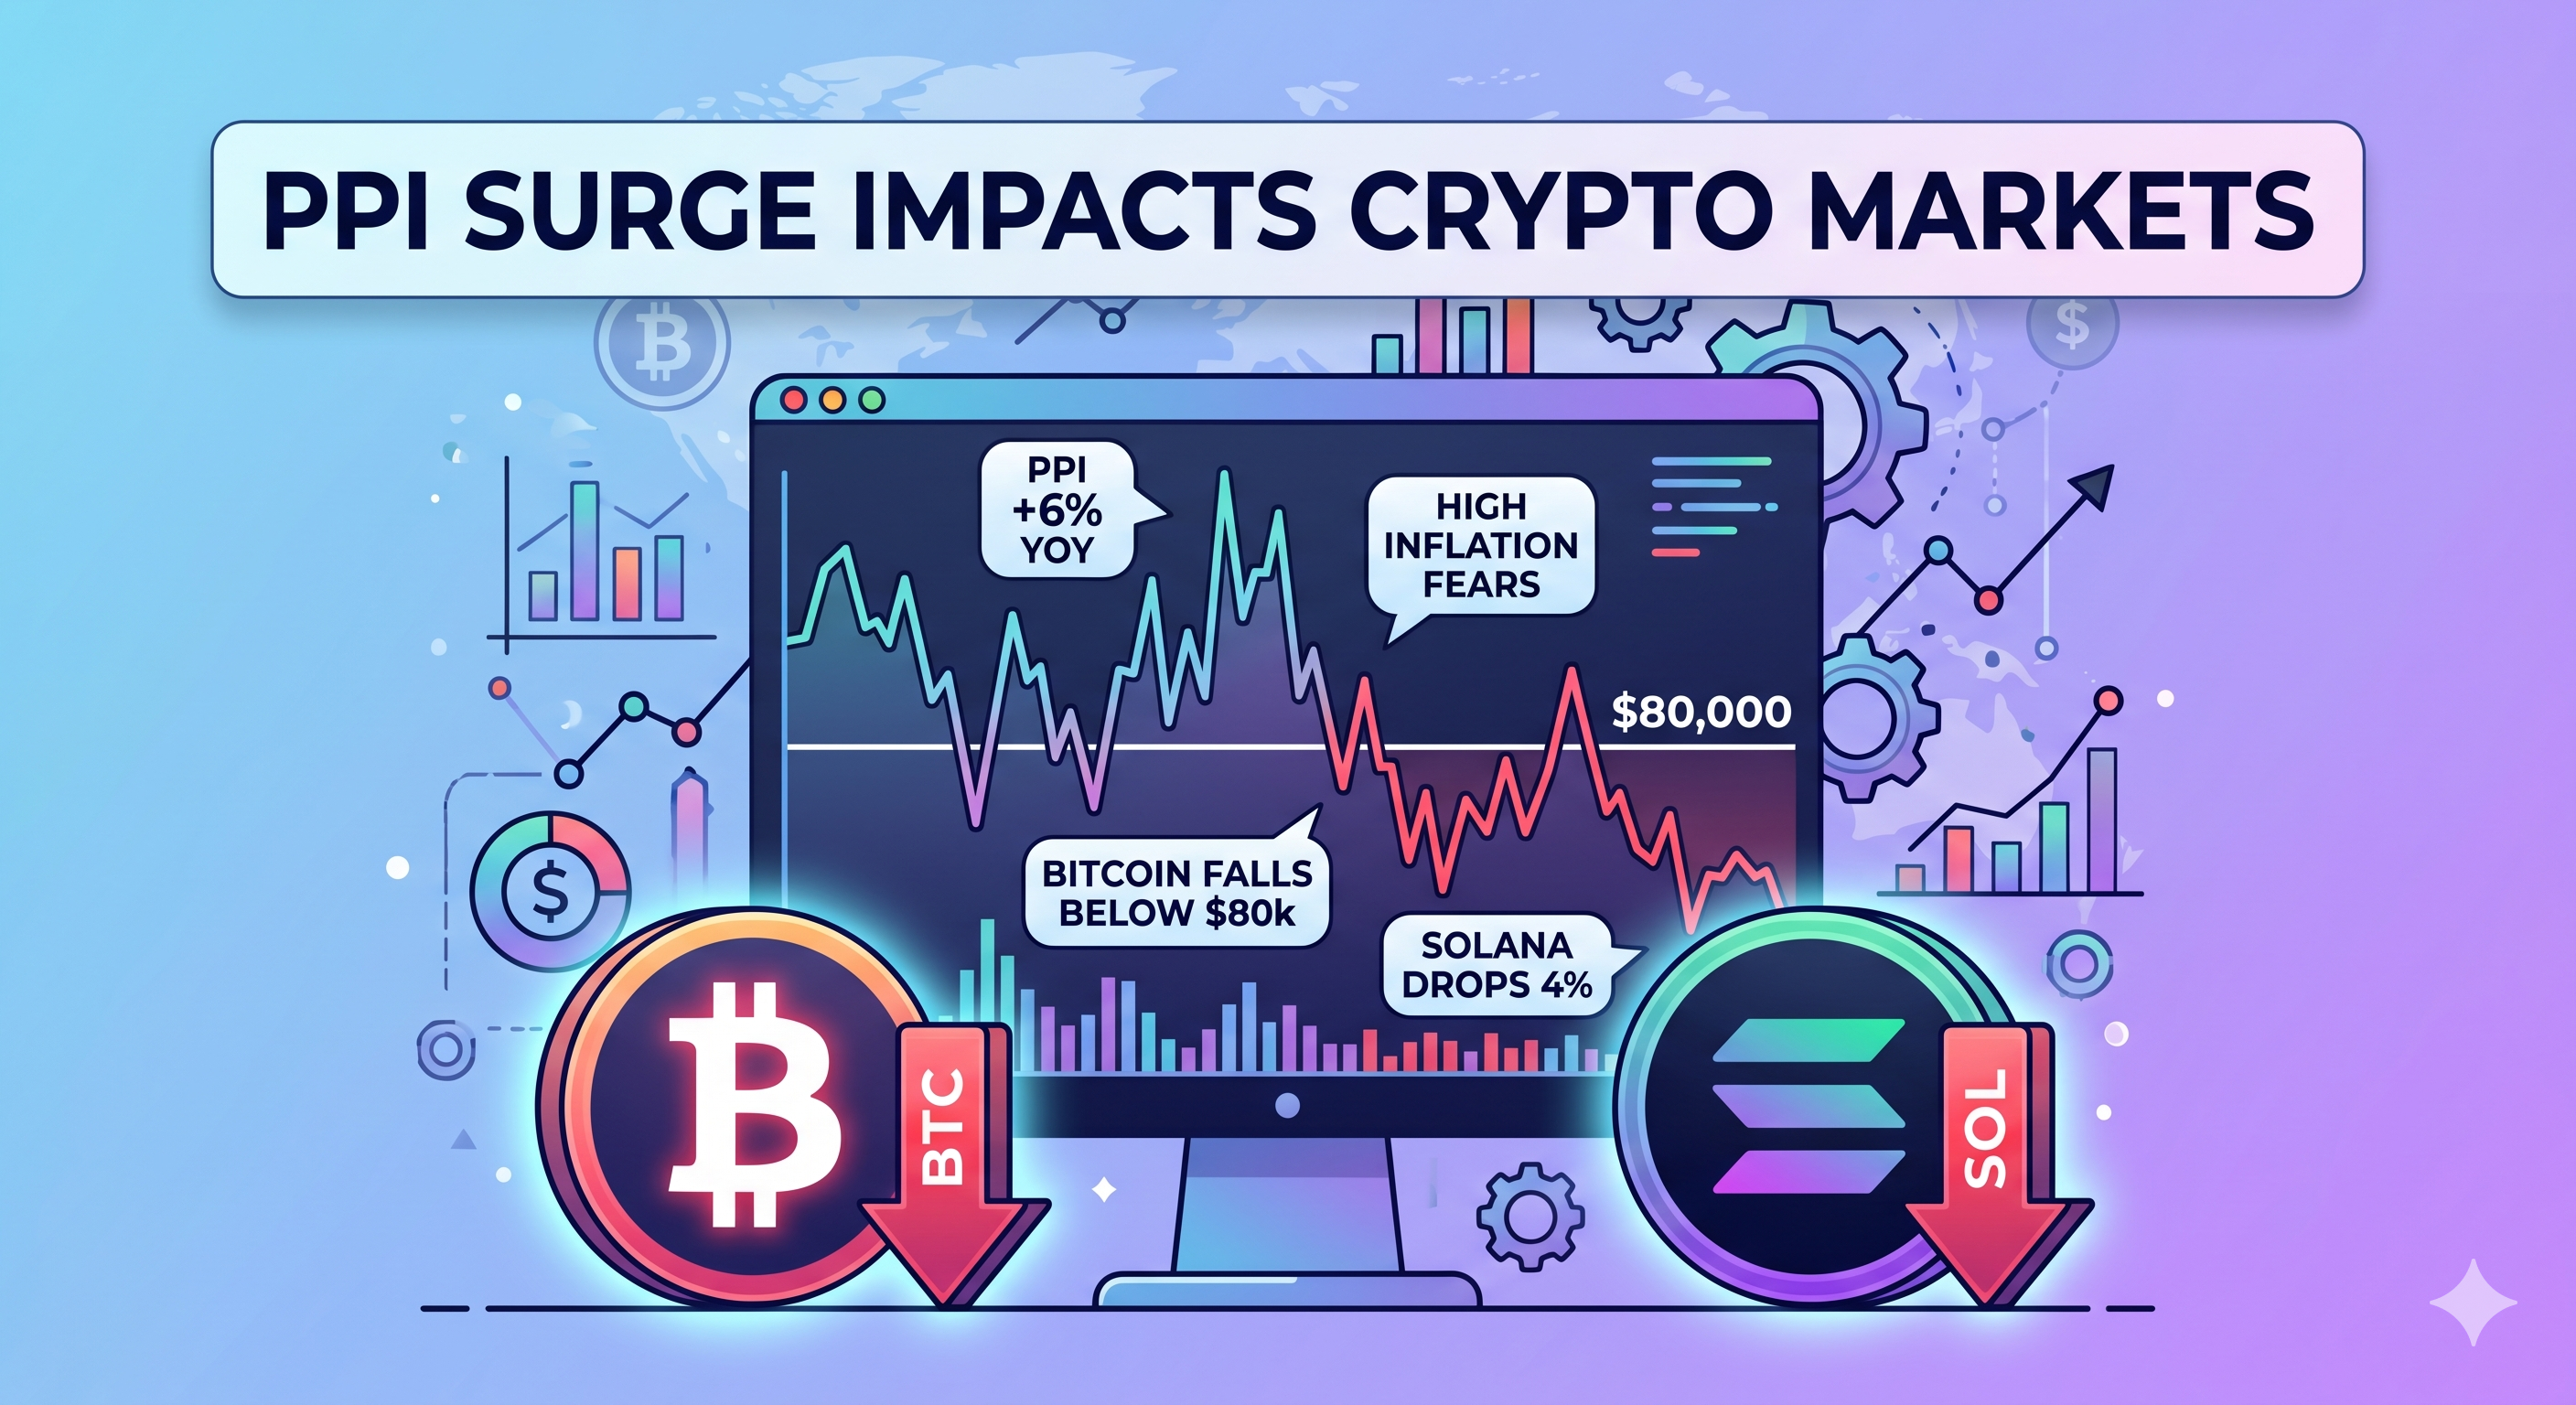
Producer price inflation just hit its highest level in over two years — and crypto markets felt the shock immediately. On May 13, 2026, the U.S. Bureau of Labor Statistics reported that the Producer Price Index (PPI) for April rose 6% year-over-year, far exceeding the consensus forecast of 3.8%. Bitcoin responded by sliding below the $80,000 mark within hours, while Solana (SOL) dropped roughly 4% in the same session.
The PPI surprise reignited fears that the Federal Reserve will delay — or even reverse — its anticipated rate-cutting cycle. For crypto traders, the message was clear: sticky inflation at the wholesale level threatens the liquidity conditions that have underpinned digital asset rallies throughout early 2026. This article breaks down why PPI surged, how crypto markets reacted, and what traders should watch next.
What Is PPI and Why Does It Matter for Crypto Markets?
The Producer Price Index measures the average change in prices that domestic producers receive for their goods and services — essentially tracking inflation before it reaches consumers. A hotter-than-expected PPI reading matters for crypto because it directly influences Federal Reserve policy expectations, which in turn drive risk-asset liquidity.
PPI vs. CPI: Understanding the Inflation Pipeline
PPI sits upstream of the Consumer Price Index (CPI). When producers pay more for raw materials, energy, and logistics, those costs eventually pass through to retail prices. A PPI spike today often foreshadows a CPI increase one to three months later.
For Bitcoin and altcoins, this pipeline effect is critical. If markets begin pricing in higher future CPI readings based on the PPI surprise, expectations for Fed rate cuts get pushed further out — or disappear entirely. According to CME FedWatch data on May 13, the probability of a June 2026 rate cut dropped from 62% to approximately 38% within hours of the PPI release.
Why Crypto Is Sensitive to Inflation Data
Digital assets have increasingly traded as macro-sensitive risk assets since 2022. Bitcoin's correlation with the Nasdaq 100 has hovered between 0.5 and 0.7 throughout Q1 2026, meaning equity-market reactions to inflation data directly spill into crypto.
This is not a crypto-specific phenomenon. It is a macro repricing event that hits every asset class competing for the same pool of speculative capital.
Why Did April 2026 PPI Surge to 6%?
The April PPI report shocked markets primarily because of a sharp rebound in energy costs, persistent services inflation, and renewed supply-chain pressures tied to global trade disruptions. According to CNBC's reporting on May 13, 2026, several compounding factors drove the overshoot.
Energy Prices Led the Charge
Wholesale energy costs surged as the primary driver of the headline PPI beat. Crude oil prices had climbed roughly 18% between February and April 2026, driven by OPEC+ production discipline and escalating geopolitical tensions in the Middle East. Gasoline and diesel wholesale prices rose sharply, feeding directly into the PPI goods component.
Natural gas prices also contributed. An unseasonably warm spring across the southern United States pushed electricity demand — and therefore natural gas consumption — above seasonal norms. The energy component of PPI rose an estimated 4.1% month-over-month, the largest single-month increase since early 2024.
Services Inflation Remained Sticky
Beyond energy, the services component of PPI showed no signs of cooling. Transportation and warehousing costs accelerated, partly reflecting higher fuel surcharges passed through by logistics providers. Healthcare services and financial services also posted above-trend increases.
This stickiness in services inflation is particularly concerning for the Fed because services make up roughly two-thirds of the U.S. economy. Even if energy prices stabilize, persistent services inflation can keep headline PPI — and eventually CPI — elevated for quarters.
Trade Policy and Tariff Effects
Renewed tariff escalation between the U.S. and several trading partners added input cost pressure across manufacturing sectors. According to multiple reports, tariffs on imported intermediate goods — including semiconductors, steel, and certain agricultural inputs — pushed producer costs higher in April.
These trade-related cost increases are structural rather than transitory. Unlike energy price swings, tariff-driven inflation does not self-correct through market mechanisms. Producers absorb the costs, pass them downstream, or both — and the PPI data reflected exactly that dynamic.
How Did Bitcoin React to the PPI Surprise?
Bitcoin fell below $80,000 for the first time in several weeks, dropping from approximately $82,400 to a session low near $79,200 within four hours of the PPI release on May 13, according to CoinDesk's live market coverage. The decline represented a roughly 3.9% intraday drawdown.
Liquidation Cascade Amplified the Move
The initial macro-driven selling triggered a cascade of leveraged long liquidations on major derivatives exchanges. According to on-chain data aggregators, approximately $320 million in long positions were liquidated across Bitcoin futures markets within the first six hours of the PPI release.
This liquidation dynamic is a recurring pattern in crypto sell-offs. Leveraged traders using 5x to 20x margin get stopped out as price breaches key support levels, creating forced selling that pushes prices further down. The $80,000 level had served as a psychological and technical support zone, and its breach accelerated the liquidation wave.
Spot Selling vs. Derivatives-Driven Decline
Notably, the sell-off appeared to be driven more by derivatives deleveraging than by spot market selling. Bitcoin spot ETF flows on May 13 showed modest net outflows of approximately $95 million — significant but not panicked. By contrast, perpetual futures funding rates flipped sharply negative, indicating that short positioning surged after the PPI data.
This distinction matters for assessing the durability of the decline. Derivatives-driven sell-offs often reverse more quickly than spot-driven ones because forced liquidations create temporary price dislocations rather than reflecting fundamental reassessment.
Key Technical Levels to Watch
Bitcoin's drop below $80,000 puts several technical levels in focus:
|
Level
|
Significance
|
|
$79,000 - $79,500
|
Session low and immediate support zone
|
|
$74,000 - $75,000
|
Major demand zone from March 2026 consolidation
|
|
$82,500
|
Resistance — previous support now flipped
|
|
$85,000
|
Upper resistance and pre-sell-off range high
|
A sustained close below $79,000 on the daily chart would signal potential for a deeper correction toward the 200-day moving average. Conversely, a quick reclaim of $82,000 or above would suggest the dip was a liquidation-driven overreaction.
Why Did Solana Drop 4% and How Are Altcoins Affected?
Solana (SOL) fell approximately 4% on May 13, underperforming Bitcoin's decline and reflecting the typical altcoin beta amplification during macro-driven sell-offs. SOL dropped from around $168 to roughly $161 in the hours following the PPI release.
Altcoin Beta: Why SOL Falls Harder Than BTC
Altcoins historically exhibit higher beta — meaning they move more aggressively in both directions relative to Bitcoin. During risk-off events, capital rotates out of higher-risk altcoins first. Solana, despite its strong ecosystem growth in 2026, remains more volatile than Bitcoin due to its smaller market capitalization and higher concentration of speculative positioning.
The SOL/BTC pair declined roughly 0.5% on the day, confirming that Solana's underperformance was partly a function of its higher beta rather than any SOL-specific negative catalyst.
DeFi and On-Chain Activity Impact
Solana's DeFi ecosystem saw a notable spike in liquidations as SOL's price decline triggered collateral calls on lending protocols. According to DeFi tracking platforms, approximately $45 million in Solana-based DeFi positions were liquidated on May 13. Total value locked (TVL) on Solana dipped roughly 3% as users withdrew collateral to avoid further liquidation risk.
What Does the PPI Surprise Mean for Fed Policy and Crypto Outlook?
The hotter-than-expected PPI reading significantly complicates the Federal Reserve's path toward rate cuts — and this policy uncertainty is the primary headwind for crypto markets in the near term. The April PPI data suggests that the Fed may hold rates at current levels through at least Q3 2026.
Rate Cut Expectations Have Shifted Dramatically
Before the PPI release, markets were pricing in two to three rate cuts by the end of 2026. After the data, fed funds futures shifted to price in only one cut — and some analysts now argue that a rate hike cannot be entirely ruled out if CPI follows PPI higher.
This repricing has direct implications for crypto. The Bitcoin rally from $55,000 to above $80,000 between late 2025 and early 2026 was significantly fueled by expectations of monetary easing. If those expectations continue to erode, the fundamental case for the rally weakens.
Historical Precedent: PPI Surprises and Bitcoin
Looking at recent history, Bitcoin's reaction to inflation surprises has been consistently negative in the short term but varied over longer horizons. The January 2025 CPI surprise, for example, triggered a 5% BTC decline over 48 hours, but prices recovered within two weeks as markets digested the data.
The key variable is whether a single data point changes the broader narrative or merely creates a temporary shock. If the May CPI report (due in mid-June) confirms the inflationary trend suggested by PPI, the sell-off could deepen. If CPI comes in softer, the PPI reaction may prove to be an overreaction.
Conclusion
The April 2026 PPI report delivered a significant upside surprise, with producer prices rising 6% year-over-year — well above the 5.2% consensus. The surge was driven primarily by soaring energy costs, persistent services inflation, and tariff-related input price increases. Crypto markets reacted swiftly: Bitcoin fell below $80,000 for the first time in weeks, while Solana declined approximately 4% and the broader altcoin market experienced even steeper losses.
The sell-off was amplified by leveraged long liquidations totaling hundreds of millions of dollars across derivatives markets. However, the derivatives-driven nature of the decline suggests that forced selling — rather than fundamental capitulation — was the primary mechanism.
Looking ahead, the critical question is whether the PPI spike signals a broader inflation re-acceleration or represents a one-month anomaly driven by energy volatility. The May CPI report, due in mid-June, will be the next major data point. Until then, traders should expect elevated volatility and prepare for both bullish and bearish scenarios. Risk management — including appropriate position sizing and stop-loss discipline — remains essential in this uncertain macro environment.
FAQs
Does PPI data always cause Bitcoin to drop?
No — Bitcoin's reaction depends on whether PPI comes in above or below expectations, not the absolute level. A PPI reading that matches consensus typically has minimal market impact. Only surprises — in either direction — trigger significant price moves. A below-expectations PPI would likely be bullish for Bitcoin.
How long do crypto sell-offs from inflation data typically last?
Inflation-driven crypto sell-offs have historically lasted between two and ten days before prices stabilize or recover. The duration depends on whether subsequent data confirms or contradicts the initial surprise. Derivatives-driven liquidation sell-offs, like the one on May 13, tend to find a floor more quickly — often within 48 to 72 hours.
Should I sell my crypto after a hot PPI report?
Selling immediately after a PPI surprise has historically been a suboptimal strategy because the sharpest declines occur within the first few hours — meaning much of the damage is already done by the time most retail traders react. A more measured approach involves assessing whether the data changes the broader macro narrative or represents a temporary shock before making portfolio adjustments.