
What is Moving Average in crypto?
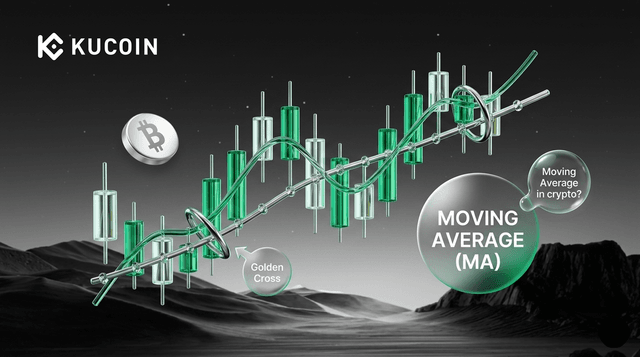
Key Takeaways
-
Trend Identification: Moving averages smooth out price data to reveal the underlying market trend (Bullish or Bearish).
-
Lagging Indicator: Because they are based on past prices, MAs tell you what has happened, rather than predicting the exact future.
-
Support & Resistance: Many traders use specific MAs (like the 50-day or 200-day) as "floors" or "ceilings" for price action.
-
Crossovers: When a short-term MA crosses a long-term MA, it signals a major shift in market momentum.
What is a Moving Average in Crypto?
A Moving Average is a technical indicator that constantly updates the average price of a cryptocurrency over a specific number of days, hours, or periods.
By averaging the price, it "smooths" the chart, making it easier to see if an asset is actually trending upward or just experiencing a temporary spike. In crypto, where "flash crashes" are common, the Moving Average acts as a stabilizer for your technical analysis.
The Two Main Types of Moving Averages
Simple Moving Average (SMA)
The SMA is the most basic form. It calculates the average price of a crypto asset over a set period by adding up the closing prices and dividing by the number of time periods.
-
Best for: Identifying long-term support and resistance levels.
Exponential Moving Average (EMA)
The EMA is more "sensitive" because it gives more weight to the most recent price data.
-
Benefit: It reacts faster to sudden price changes, which is highly useful in the volatile crypto market.
-
Best for: Day traders and swing traders who need to react quickly to news or market shifts.
How to Use Moving Averages in Your Strategy
To use MAs effectively on our exchange platform, you should look for two primary signals:
The "Golden Cross" and "Death Cross"
These are the most famous signals in the industry, involving the 50-day and 200-day MAs:
-
Golden Cross: When the 50-day MA crosses above the 200-day MA. This is a massive "Bullish" signal suggesting a long-term uptrend.
-
Death Cross: When the 50-day MA crosses below the 200-day MA. This typically signals the start of a "Bear" market.
Moving Average as Support
During a bull run, the price of Bitcoin or Ethereum often "bounces" off its 20-day or 50-day Moving Average. If the price falls to the MA and stays above it, traders view this as a "buy the dip" opportunity. Conversely, if the price stays below the MA, that line becomes "Resistance," making it harder for the price to move up.
Summary
A Moving Average is a foundational tool that helps crypto traders simplify complex market movements. While the SMA offers a birds-eye view of long-term health, the EMA provides a high-speed look at immediate momentum. By combining different timeframes, you can filter out market noise and align your trades with the actual direction of the market.
Sign up for KuCoin today to buy, sell, and manage your entire crypto portfolio in one simple dashboard. Register Now!
FAQs
Which timeframe is best for crypto moving averages?
It depends on your style. Day traders often use the 9-period or 20-period EMA. Long-term investors (HODLers) focus on the 50-day and 200-day SMA to understand the broader market cycle.
Why is the 200-day Moving Average so important?
The 200-day SMA is considered the "ultimate" trendline. If a cryptocurrency is trading above its 200-day SMA, it is technically in a bull market. If it falls below, it is officially in bear territory.
Can I use Moving Averages alone to trade?
No single indicator is 100% accurate. Professional traders usually combine MAs with Volume or the Relative Strength Index (RSI) to confirm that a trend is real before entering a position.
Why does the EMA react faster than the SMA?
The EMA uses a mathematical "multiplier" that prioritizes the latest price. This makes it more relevant for "scalping" or trading "altcoins" that move 10-20% in a single day.
Further reading:


