
What is Candlestick in Crypto?
Key Takeaways
-
Market Psychology: Candlestick charts reveal the battle between buyers (bulls) and sellers (bears) beyond simple price lines.
-
Anatomy of a Candle: Each candle tracks four data points: Open, Close, High, and Low within a specific timeframe.
-
Visual Indicators: The "Body" shows the price range between open and close, while "Wicks" represent price rejection at extremes.
-
Reversal Signals: Patterns like the Hammer and Shooting Star help traders identify potential trend shifts early.
-
Volume Synergy: Pairing candlestick shapes with trading volume confirms the strength and validity of a price move.
In the digital asset markets, where Bitcoin and altcoins trade 24/7 with lightning speed, a simple line chart is often insufficient. To truly understand market sentiment and institutional intent, professional traders rely on one primary tool: the Japanese Candlestick chart.
If you have ever asked, "what is candlestick in crypto?", you are looking for the key to deciphering the psychological battle between "bulls" (buyers) and "bears" (sellers). Unlike traditional charts, candlesticks provide a multi-dimensional view of price action, revealing hidden opportunities within the volatility.
Anatomy of a Trade: The Crypto Candlestick
A candlestick is a visual representation of price movement for a specific timeframe—whether it is one minute, one hour, or one day. Each "candle" tells a story of what happened during that window of time.
Every candlestick consists of four data points:
-
Open: The price at which the period began.
-
Close: The price at which the period ended.
-
High: The maximum price reached during the period.
-
Low: The minimum price reached during the period.
The Body and the Wick
The Body is the thick part of the candle, representing the range between the Open and Close prices.
-
Green Candle: If the close is higher than the open, the market is bullish.
-
Red Candle: If the close is lower than the open, the market is bearish.
The Wicks (or shadows) are the thin lines extending above and below the body. These show how much price rejected certain levels. For instance, a long upper wick on the KuCoin exchange suggests that buyers tried to push the price up, but sellers aggressively pushed it back down.
Why Candlesticks are Critical for Crypto Traders
Understanding what is candlestick in crypto allows you to move beyond reactionary trading. By analyzing the shape and size of these candles, you can predict potential reversals before they happen.
On KuCoin Lite, these candlestick visuals are streamlined to help mobile users quickly identify whether the market is gaining momentum or facing exhaustion. For example, if you see a series of small bodies with increasing volume, it may indicate a period of accumulation before a massive breakout.
Powerful Candlestick Patterns Every Expert Uses
To master crypto trading, you must recognize specific "signatures" left by the market. Here are the most reliable patterns:
The Hammer (Bullish Reversal)
The Hammer occurs at the bottom of a downtrend. It has a small body and a long lower wick.
-
The Insight: Sellers drove the price significantly lower, but by the end of the period, buyers stepped in to push the price back near the open.
-
The Action: This is often the first sign of a bottom. Experts look for new crypto gems forming hammers on the 4-hour or Daily charts as a signal to enter.
The Shooting Star (Bearish Reversal)
The opposite of a Hammer, the Shooting Star appears at the top of a rally. It has a long upper wick and a small lower body.
-
The Insight: Buyers were exhausted, and sellers have taken control of the "ceiling."
-
The Action: This is a classic "exit" or "short" signal, indicating that the rally is likely over.
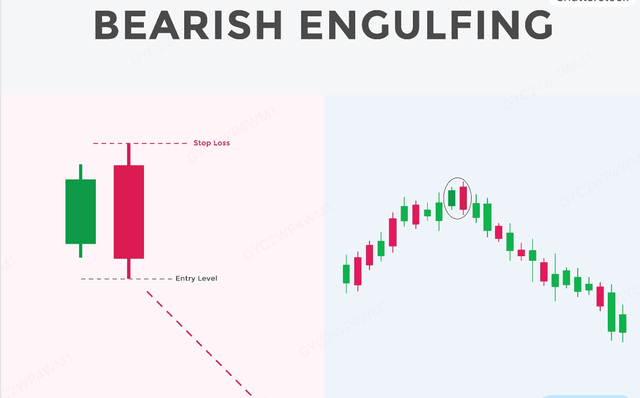
The Engulfing Pattern (Trend Shift)
An Engulfing pattern consists of two candles. A "Bullish Engulfing" occurs when a large green candle completely covers (engulfs) the body of the previous red candle.
-
The Insight: The bulls have completely overwhelmed the bears.
-
The Action: This is one of the most high-probability signals for a trend continuation.
Advanced Insight: Candlesticks and Volume
A candlestick alone is powerful, but when paired with Volume, it becomes a lethal trading weapon.
-
If you see a large green candle at high volume, the trend is strong and likely to continue.
-
If you see a large green candle at low volume, it may be a "fakeout" or a "bull trap," as there is no real money backing the move.
Traders often use the KuCoin Trading Bot to set up automated strategies that trigger only when specific candlestick patterns coincide with high trading volume, ensuring they only enter high-probability setups.
The KuCoin Edge: Visualizing the Market
Whether you are using the Pro interface or the KuCoin Lite version, the platform provides real-time, high-fidelity candlestick data.
-
Custom Timeframes: You can switch from 1-minute candles for scalping to Weekly candles for long-term "HODLing."
-
Integrated Indicators: On KuCoin, you can overlay RSI, MACD, and Bollinger Bands directly onto your candlestick chart to create a "Confluence" of signals.
Conclusion: The Language of the Market
Learning what is candlestick in crypto is the foundation of all technical analysis. It is the language through which the market speaks to you. By mastering the anatomy of a candle and recognizing key patterns like Hammers and Engulfing candles, you can spot institutional footprints and trade with the "smart money."
FAQs for Candlestick in Crypto
Does the color of the candlestick matter?
Yes. Generally, green indicates a price increase and red indicates a price decrease. However, the size of the candle body and the length of the wicks often provide more information about future price directions than the color alone.
Which timeframe is best for reading candlesticks?
It depends on your style. Scalpers use 1-minute to 15-minute candles. Swing traders prefer 4-hour and Daily candles. Generally, the higher the timeframe, the more reliable the candlestick signal is.
What is a "Doji" candlestick?
A Doji is a candle where the Open and Close prices are almost identical, resulting in a very thin body. It represents market indecision. When a Doji appears after a long trend, it often warns that the trend is about to reverse.
Create a free KuCoin account to discover the next crypto gems and trade over 1,000 global digital assets today. Create Now!
Further Reading:


