What is Volatility skew analysis in crypto?
How do professional crypto traders anticipate major market shifts before they happen on the spot charts? They do it by tracking the choices of options traders, specifically through a metric known as volatility skew. Volatility skew analysis is a technical method of assessing market sentiment by comparing the implied volatility of out-of-the-money put options against out-of-the-money call options for the same underlying cryptocurrency and expiration date.Instead of treating market sentiment as a subjective feeling, this framework measures the exact premium traders are willing to pay for downside insurance versus upside speculation.Understanding this dynamic allows market participants to map institutional positioning, identify structural mispricings, and manage capital risk. In the digital asset space, where extreme price swings are common, reading the volatility skew is an essential discipline for executing sophisticated hedging and yield-generation strategies.
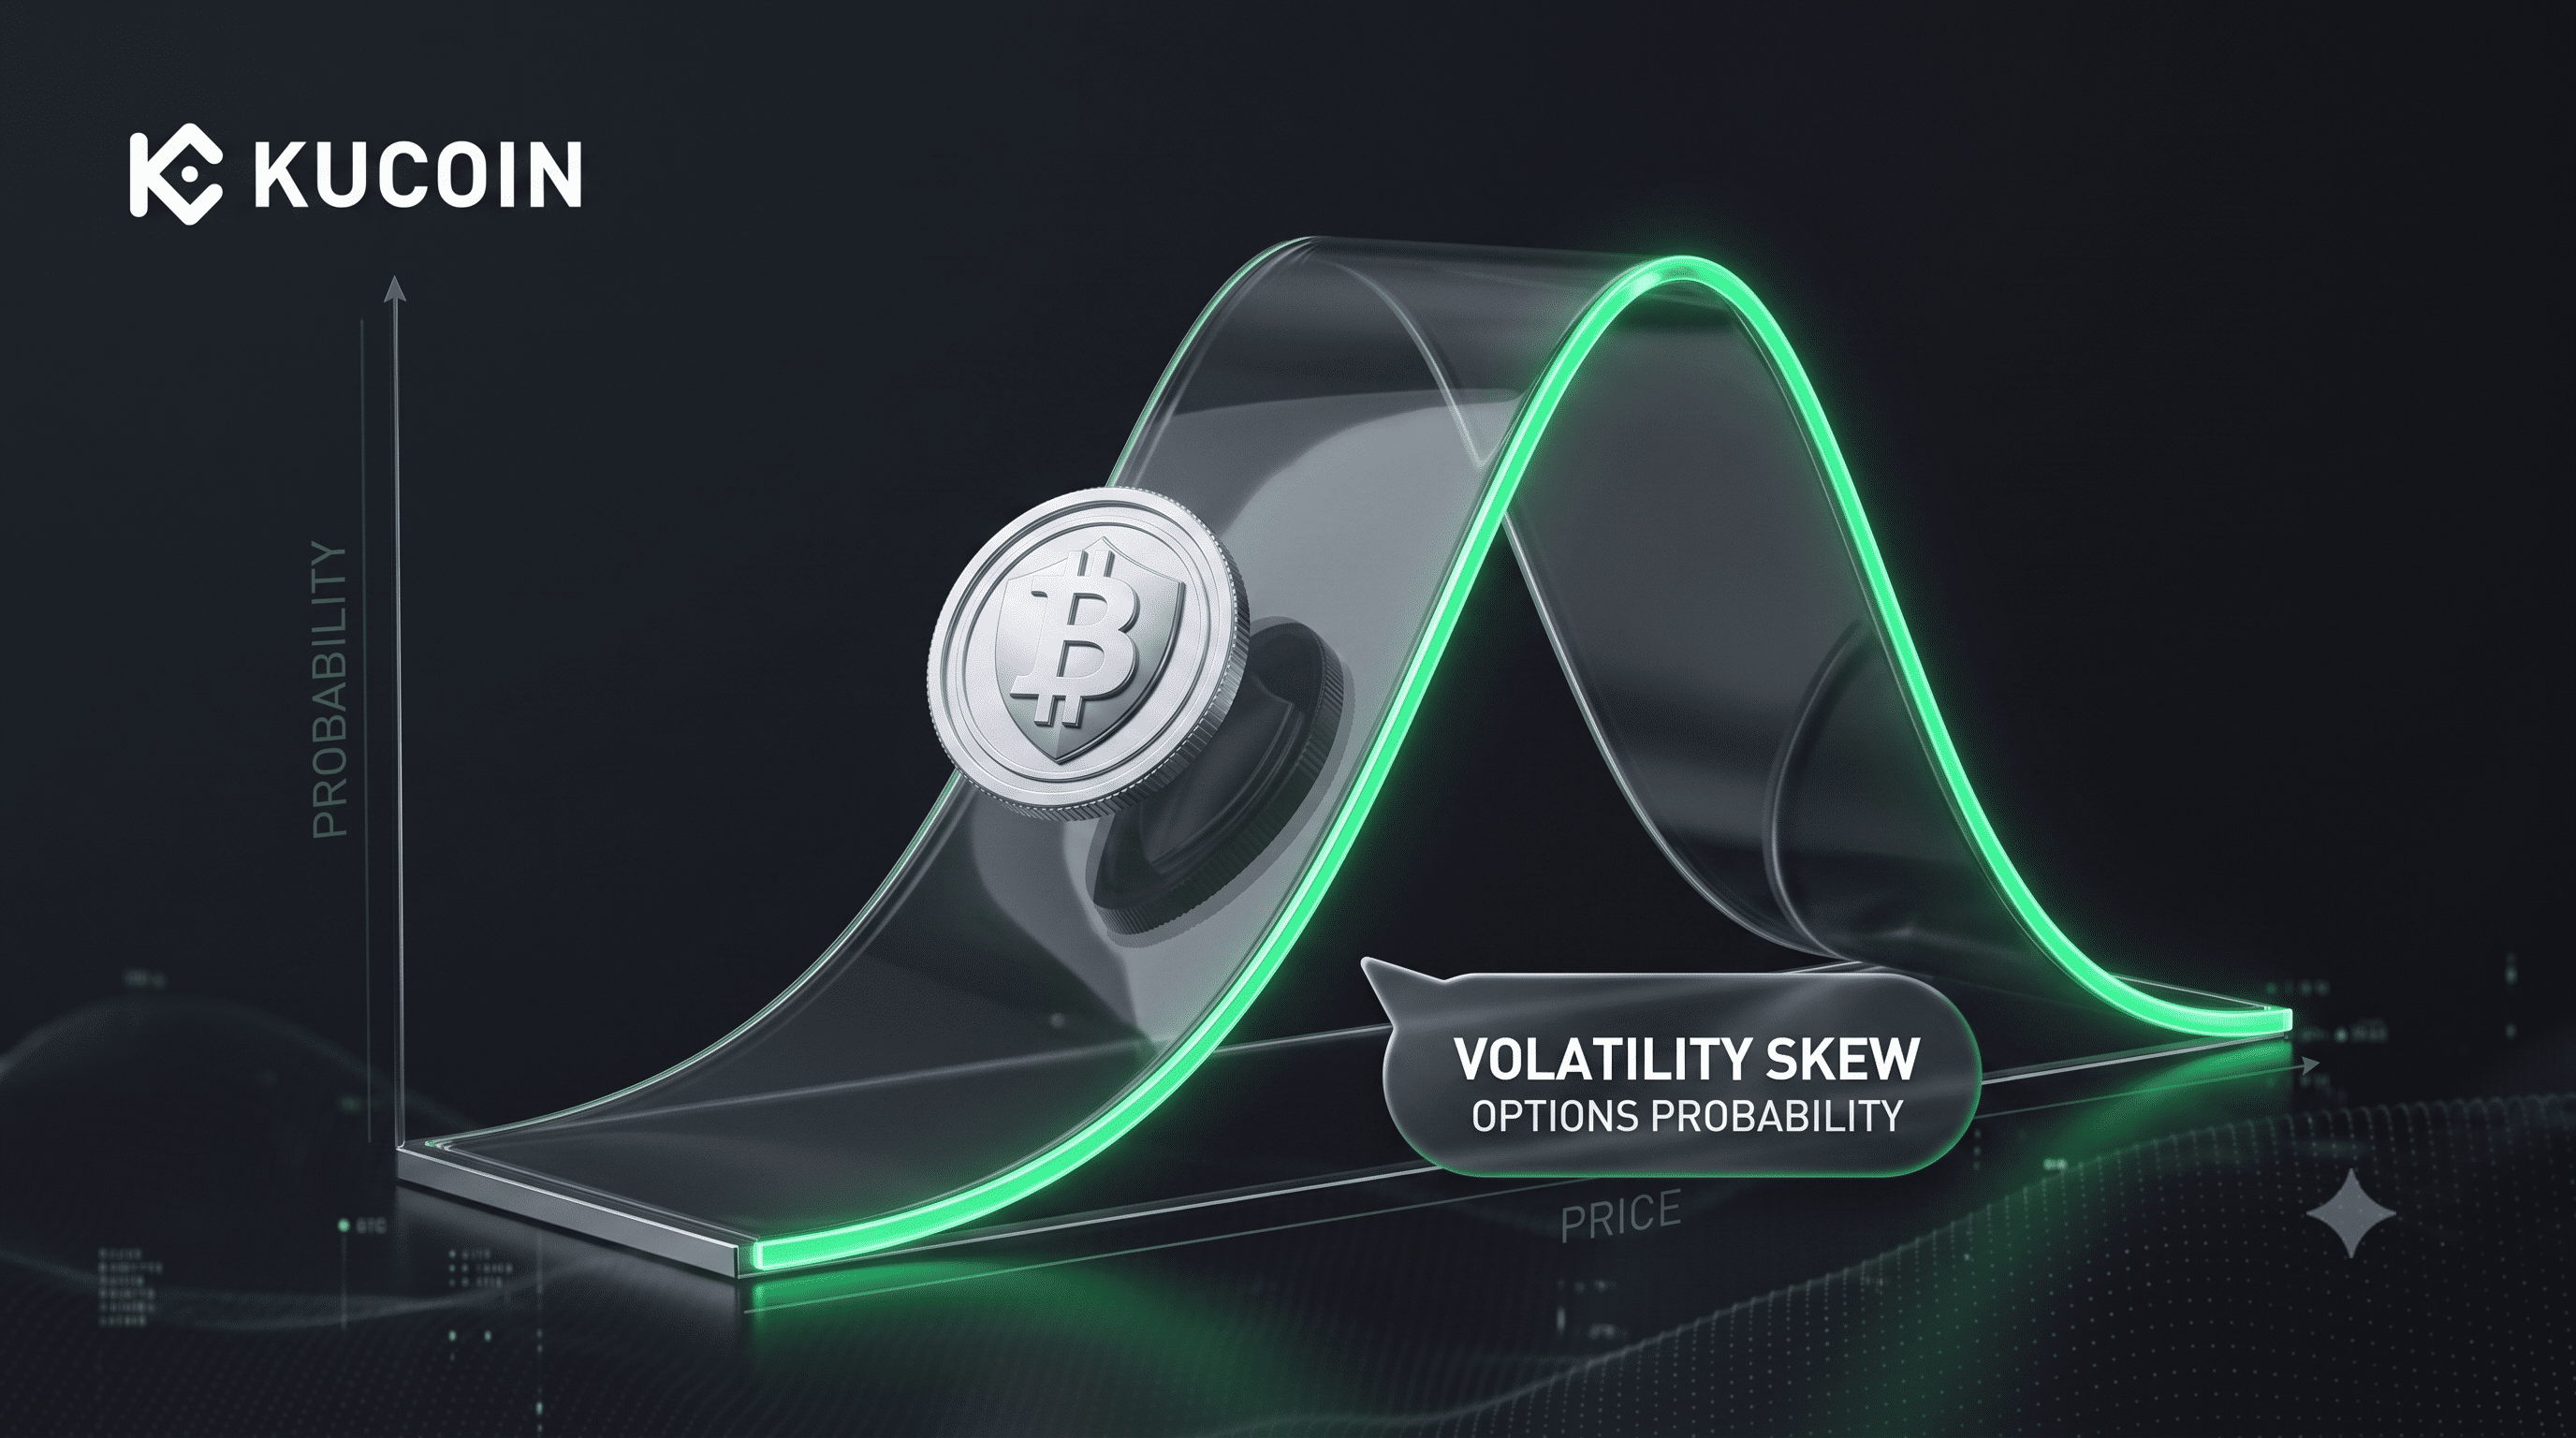
What Is Volatility Skew in Cryptocurrency Markets?
Volatility skew is the structural variation in implied volatility across different strike prices for crypto options contracts with the identical expiration date.Implied volatility—which serves as a forward-looking metric of expected asset price fluctuations—is rarely uniform across all strike prices.Instead, options that are deep out-of-the-money (OTM) typically command higher implied volatility than those that are at-the-money (ATM).This structural deviation forms a graphical curve when plotted on a chart, providing an immediate visual mapping of how the market distributes risk.
In traditional equity markets, this curve is often a permanent down-sloping line known as a "volatility smirk," driven by a persistent demand for put options as portfolio insurance.In cryptocurrency markets, however, the skew is highly dynamic and regularly shifts between a classic smile, a forward smirk, and an inverted smirk. According to options market data from Deribit, the world’s largest crypto options exchange by trading volume, these shifts depend entirely on macro sentiment, institutional capital flows, and localized liquidations.
Why Does Volatility Skew Occur in Crypto Options?
Volatility skew occurs primarily due to supply-demand imbalances, structural behavioral biases, and institutional hedging requirements.When market participants aggressively buy a specific type of option contract—such as downside protection during a market crash—the price of that option rises. Because option pricing models use implied volatility as the primary variable for price adjustments, this surge in buying pressure pushes the implied volatility of those specific strike prices upward, distorting the curve.
There are three primary drivers behind this pricing asymmetry in crypto:
-
Asymmetric Risk Management: Institutional investors holding large spot positions in Bitcoin or Ethereum frequently buy OTM put options to safeguard against sudden downside gaps, while simultaneously writing OTM call options to generate yield.
-
Leveraged Speculation: Retail traders and speculative entities routinely favor deep OTM call options during bull markets to capture highly leveraged upside exposure for minimal upfront capital, driving call premiums higher.
-
Market Maker Hedging: Options market makers must constantly adjust their inventory risk by dynamically rehedging their positions in the spot and futures markets, a process known as delta and gamma hedging, which forces them to charge a premium for high-demand strikes.
How Do You Measure and Calculate Crypto Volatility Skew?
The most prevalent and reliable method to calculate crypto volatility skew is the 25-delta risk reversal metric.This calculation subtracts the implied volatility of an out-of-the-money put option with a delta of -0.25 from the implied volatility of an out-of-the-money call option with a delta of +0.25. Delta measures how much an option's price is expected to move per $1 change in the underlying crypto asset, and the 25-delta threshold represents options that sit roughly 10% to 15% away from the current spot market price.
25-Delta Risk Reversal = Implied Volatility of 25-Delta Call - Implied Volatility of 25-Delta Put
When the resulting number is positive, it reveals that call options are more expensive than puts, indicating a prevailing bullish market sentiment. Conversely, a negative risk reversal value proves that put options are trading at a premium relative to calls, signaling a bearish outlook or heightened demand for downside protection. According to data published by the CME Group, during acute market corrections, the 25-delta risk reversal can plunge deeply into negative territory—reaching multi-year lows near -19.34—as institutional participants scramble to secure immediate portfolio hedges.
What Are the Main Types of Volatility Skew Patterns?
Traders categorize volatility skew into three distinct shapes, each revealing a different phase of market psychology and structural risk distribution. Recognizing these patterns allows market participants to adapt their trading frameworks to the exact regime currently dominating the market.
The Volatility Smile
A volatility smile manifests when both out-of-the-money puts and out-of-the-money calls trade at substantially higher implied volatilities than at-the-money options.This symmetrical structure demonstrates that the market is preparing for an imminent, explosive breakout but remains highly uncertain about the actual direction of the move. Traders frequently observe this pattern directly before highly anticipated events, such as Federal Reserve interest rate announcements, consumer price index (CPI) updates, or systemic crypto network upgrades.
The Forward Smirk (Bullish Skew)
A forward smirk occurs when the implied volatility curve slopes upward as it moves toward higher strike prices. This pattern signals that out-of-the-money call options are commanding a massive price premium over corresponding out-of-the-money puts. In cryptocurrency markets, this shape is highly common during prolonged macro expansion phases, where institutional and retail participants aggressively bid up upside options to maximize capital efficiency during a market rally.
The Reverse Smirk (Bearish Skew)
A reverse smirk appears when the implied volatility curve slopes sharply downward from left to right, meaning that out-of-the-money put options carry a significant volatility premium over calls.This pattern indicates that the market is heavily pricing in tail-risk protection against a sudden, severe market crash. In traditional equities, this is the default state of the market, but in crypto, it highlights periods of extreme fear, systematic deleveraging, or major macroeconomic stress.
How to Apply Volatility Skew Analysis to Crypto Trading Strategies
Professional crypto derivatives traders utilize volatility skew analysis to uncover structural execution advantages, execute market-neutral strategies, and optimize entry levels. By identifying which options are overvalued or undervalued relative to the broader volatility surface, traders can design highly precise structures.
Identifying Market Tops and Bottoms
A structural divergence between spot cryptocurrency prices and the 25-delta risk reversal often acts as a reliable leading indicator for major trend reversals. For example, if Bitcoin's spot price continues to rise over several weeks but the options risk reversal trends steadily downward into negative territory, it reveals that institutional players are quietly buying put options to protect their unrealized spot gains. According to derivatives analytics recorded by the CME Group, this precise divergence often precedes significant market corrections, as the heavy buying of puts exposes a structural lack of true bullish conviction under the surface.
Structuring Call-Overwriting and Yield Strategies
When the volatility skew exhibits a strong forward smirk—meaning deep out-of-the-money call options are trading at highly inflated implied volatilities—investors can execute optimized call-overwriting strategies. By holding the underlying crypto spot asset and simultaneously selling these expensive, deep out-of-the-money calls, an investor can extract exceptionally high yields from the inflated options premium. If the market trades sideways or climbs at a moderate pace without hitting the extreme strike price, the trader retains the full premium alongside their spot holdings.
Designing Vertical and Diagonal Spreads
Volatility skew analysis is essential for selecting the correct strikes when deploying vertical spreads, such as bull call spreads or bear put spreads.If a trader notices that the implied volatility of a specific out-of-the-money call strike is disproportionately higher than an adjacent strike, they can buy the lower-volatility option and sell the higher-volatility option. This process allows the trader to exploit the skew difference, structurally reducing the net debit cost of entering the position while lowering the overall break-even point of the trade.
What Are the Differences Between Crypto and Traditional Equity Skew?
While the fundamental mathematics of options pricing remain identical across asset classes, the behavior of volatility skew in cryptocurrency markets differs sharply from traditional equities due to distinct structural nuances and participant profiles.
-
Extreme Dynamics and Reversals: Traditional equity markets feature a structural, almost permanent bias toward a reverse smirk because equity portfolios require constant downside put protection. Crypto options skew, by contrast, is highly fluid—it can rapidly flip from a steep bearish smirk to an aggressive bullish smirk within hours if macro sentiment turns or an institutional catalyst emerges.
-
The Implied Volatility Baseline: The baseline implied volatility for major cryptocurrencies is structurally higher than that of traditional stock indices like the S&P 500 or Nasdaq. According to options data compiled by Binance, even during historical compression regimes, Bitcoin's 30-day implied volatility index frequently bottoms out near 40% to 42%, a level considered a crisis-stage spike in traditional equity volatility markets.
-
Impact of Native Yield and Perpetuals: The crypto derivatives ecosystem is heavily anchored by perpetual swaps and funding rate mechanisms. These instruments interact directly with the options market, causing the options volatility skew to adjust dynamically to the leverage shifts occurring within the perpetual futures markets—a liquidity dynamic completely absent from legacy equity exchanges.
Should You Trade Options Using Volatility Skew Analysis on KuCoin?
Trading cryptocurrency options using volatility skew analysis on KuCoin provides retail and institutional participants with a structural edge over spot traders. KuCoin offers a highly liquid derivatives trading environment, complete with advanced risk management infrastructure, competitive fee frameworks, and deep order books across major crypto assets.
By executing options strategies on KuCoin, traders can capitalize on real-time volatility skew mispricings, hedge their spot portfolios during periods of macro market distress, and generate consistent yield using advanced multi-leg strategies. Whether you are seeking to deploy long straddles during historical volatility compressions or execute out-of-the-money call overwrites during bullish expansion phases, KuCoin delivers the institutional-grade execution tools and contract flexibility necessary to navigate complex volatility surfaces safely.
Conclusion
Volatility skew analysis serves as an invaluable diagnostic instrument for identifying the underlying structural mechanics of cryptocurrency markets. By evaluating the premium differentials between out-of-the-money put and call options via metrics like the 25-delta risk reversal, traders can look beyond basic technical charts and directly monitor institutional positioning and authentic market anxiety. Unlike traditional equity markets, which maintain a rigid, permanent downward skew due to structural portfolio insurance needs, the crypto options landscape is uniquely dynamic—shifting fluidly between smiles, forward smirks, and reverse smirks based on the broader macroeconomic climate and real-time capital distributions.
Successfully integrating skew analysis into a comprehensive trading architecture requires a disciplined approach to tracking data, an understanding of market maker rehedging constraints, and an awareness of structural macro events. When executed properly, this analysis enables traders to bypass speculative guesswork, allowing them to structure market-neutral options positions, protect portfolio capital against sudden downside liquidations, and identify high-probability turning points. Utilizing platforms like KuCoin ensures that market participants can efficiently convert these advanced insights into precisely executed, risk-managed positions.
FAQs
What does a steepening crypto volatility skew indicate?
A steepening crypto volatility skew indicates that market participants are aggressively bidding up the prices of out-of-the-money options relative to at-the-money contracts. If the curve steepens toward the put side, it proves that the market is paying an absolute premium for downside protection due to rising systemic fear. If it steepens toward the call side, it demonstrates intensive speculative demand for aggressive upside exposure.
How does implied volatility skew affect option premiums?
Implied volatility skew directly increases the premium costs of options at the specific strike prices experiencing high demand.Because option pricing models rely on implied volatility as a core input for risk calculation, a higher skew value for a particular strike means a buyer will pay a significantly higher dollar premium for that contract compared to an option of equivalent distance on the opposite side of the spot price.
Can retail crypto traders profit from monitoring risk reversals?
Yes, retail crypto traders can profit from monitoring risk reversals by using them as a leading sentiment indicator to optimize their spot and futures entries. When the risk reversal reaches historical negative or positive extremes, it signals that the derivatives market is heavily overextended, allowing retail traders to anticipate market reversals or avoid entering trades at the absolute top or bottom of a macro cycle.
What is the difference between volatility skew and a volatility smile?
The difference is that volatility skew refers generally to any structural variation in implied volatility across strike prices, usually resulting in an asymmetrical curve favoring either puts or calls.A volatility smile is a highly specific type of skew pattern where the curve is completely symmetrical, showing that both deep out-of-the-money puts and calls are priced equally high due to severe directional uncertainty.
How often should a crypto options trader analyze the skew curve?
A crypto options trader should analyze the skew curve daily, or ideally in real time before executing any multi-leg derivatives strategy. Because cryptocurrency markets operate continuously and are highly sensitive to sudden capital flows, perpetual funding rate shifts, and global macro announcements, the volatility surface can change rapidly, altering the risk-reward profile of an open position within a short timeframe.
💡 See why millions of traders choose the People’s Exchange—create your KuCoin account in under 60 seconds. Sign Up Now!


