

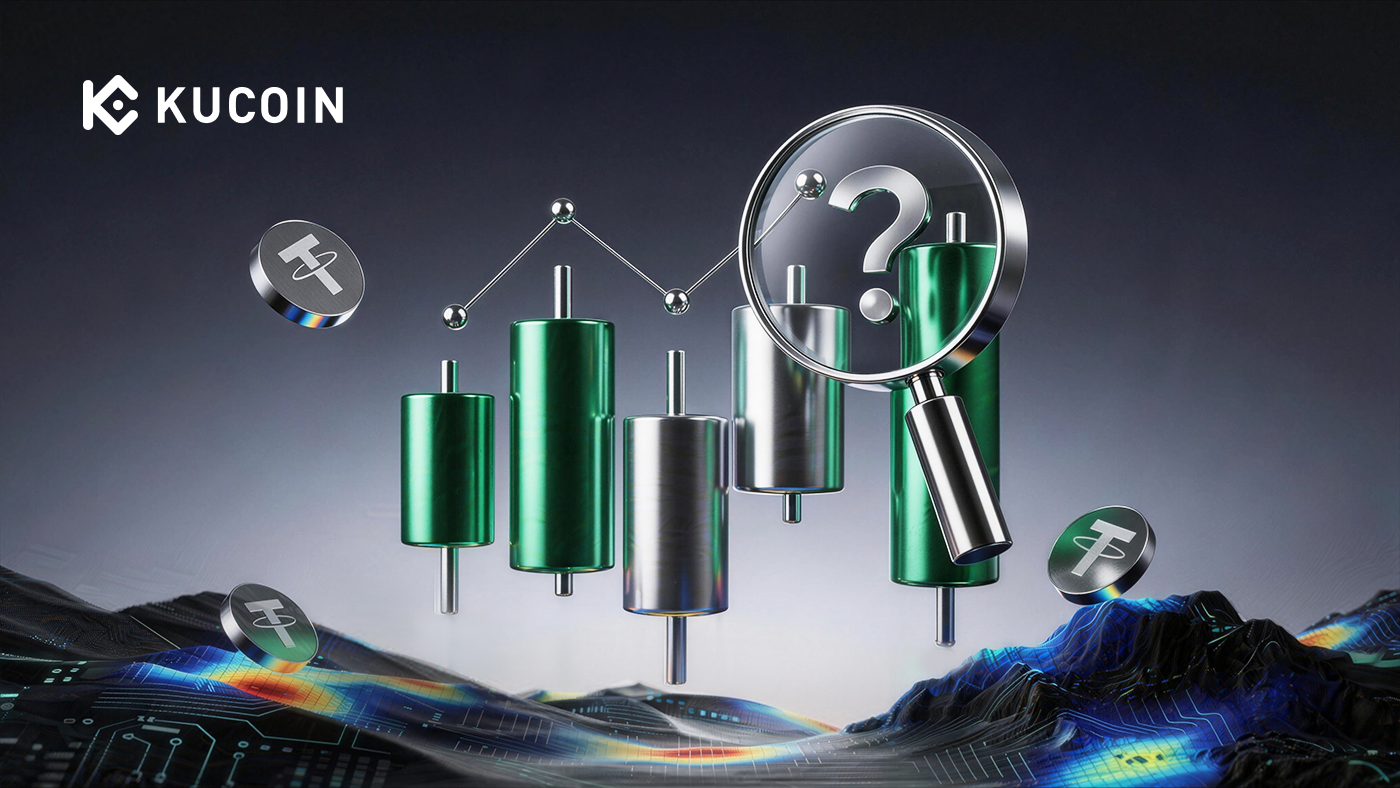
What is liquidity heatmap in crypto?
Key takeaways:
-
Visualizes Order Depth: A liquidity heatmap transforms the complex limit orders in an exchange's order book into a color-coded map.
-
Predicts Price Movement: High-liquidity zones (bright colors) often act as "magnets," attracting the price toward areas with significant buy or sell interest.
-
Identifies Support & Resistance: Thick "walls" of resting orders are easily visible as intense horizontal bands, providing more accuracy than simple trendlines.
-
Spots Liquidation Clusters: Specialized "liquidation heatmaps" show where leveraged traders are most vulnerable, often predicting sharp price squeezes.
Understanding the Liquidity Heatmap
At its core, a liquidity heatmap is a graphical representation of the market's limit orders over time. While a standard candlestick chart only tracks executed trades, the heatmap tracks pending intent.
How to Read the Colors
Most heatmaps use a color spectrum to represent order volume. While platforms vary, the general logic follows a "heat" scale:
-
Cool Colors (Blue/Purple): Low liquidity; fewer orders are resting at these price levels. Price can often move through these zones quickly.
-
Warm Colors (Yellow/Orange): High liquidity; these are "dense" areas where many limit orders are stacked.
-
Intense Colors (White/Bright Red): Extreme liquidity; often referred to as "walls," these represent massive institutional or whale interest that can stop a price move in its tracks.
Liquidity Heatmap vs. Order Book
An order book is a vertical list of numbers that changes every millisecond, making it nearly impossible for humans to track. A heatmap takes that data and plots it horizontally across time. This allows you to see if a "buy wall" has been standing for hours or if it was just placed a few seconds ago (a tactic often used in "spoofing").
Strategic Uses of Liquidity Heatmaps
Traders on our platform use heatmaps to gain a 3D perspective of market structure. Here are the three most common strategies:
1. Trading the "Magnet" Effect
Market makers and algorithms often drive the price toward high-liquidity zones to ensure their orders are filled with minimal slippage. If you see a bright yellow band $500 above the current price, there is a high statistical probability that the price will move toward that "pool" of liquidity.
2. Identifying "Liquidation Squeezes"
Liquidation heatmaps specifically track where leveraged positions (longs and shorts) will be forcibly closed.
-
Short Squeeze: If a massive cluster of short liquidations sits just above the current price, a small move upward can trigger those liquidations, causing a rapid "cascade" higher.
-
Long Squeeze: Conversely, if bright clusters sit below, a drop could trigger a chain reaction of selling.
3. Setting Accurate Stop-Losses
Many retail traders place stop-losses at obvious "psychological" levels. Professional traders use heatmaps to place their stops behind a major liquidity wall. This way, the market must "eat through" millions of dollars of limit orders before reaching your stop.
Summary
A liquidity heatmap is a powerful forward-looking indicator that reveals the true supply and demand of the crypto market. By visualizing resting limit orders and liquidation levels, it allows traders to move beyond simple technical analysis and start trading based on real market depth. Whether you are scalping small moves or swing trading major trends, the heatmap provides the clarity needed to avoid traps and join the "whale" flow.
Create your free KuCoin account today to access over 700+ global crypto assets and the latest gems. Sign Up Now!
FAQs
Is a liquidity heatmap the same as a volume profile?
No. A volume profile shows where trades already happened at specific prices. A liquidity heatmap shows where orders are currently waiting to happen.
Which platforms offer liquidity heatmaps?
Popular tools include CoinGlass, Bookmap, Hyblock, and specialized indicators on TradingView. Many high-end exchanges also integrate these directly into their pro trading interfaces.
Can whales "fake" the heatmap?
Yes. This is called spoofing. A whale may place a massive limit order to create a bright "wall" on the heatmap to scare retail traders into selling, only to cancel the order seconds before the price hits it. Always look for "persistent" liquidity that stays on the map for long periods.
Does a bright zone always act as a bounce point?
Not necessarily. While a bright zone often acts as support or resistance, if the buying/selling pressure is strong enough, the price will "break" the wall. When a massive liquidity zone is finally consumed, it often leads to an extremely volatile breakout.