
What is Harmonic pattern recognition in crypto?
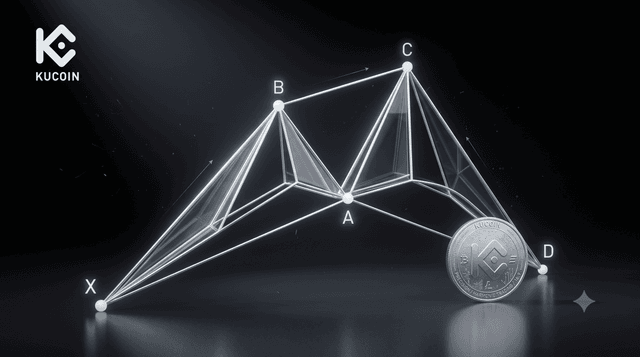
Harmonic pattern recognition in crypto is an advanced charting methodology that utilizes specific Fibonacci retracement and extension sequences to identify precise points where a cryptocurrency trend is likely to reverse.Unlike conventional chart formations like flags or head-and-shoulders, which allow for subjective interpretation, harmonic setups mandate exact mathematical relationships between five specific structural pivot points.By calculating these confluence zones, crypto traders can predict structural turning points before they happen, eliminating emotional guesswork in highly volatile markets.
What Are the Core Fibonacci Ratios Used in Harmonic Trading?
The mathematical architecture of crypto harmonic trading relies almost entirely on specialized ratios extracted from the Fibonacci sequence.These ratios act as strict filters, dictating whether a structural price wave is a legitimate harmonic leg or merely random market noise. According to a technical architecture report published by ThinkMarkets in February 2026, harmonic models categorize these parameters into two operational functions: retracements and extensions.
Retracements calculate how deeply a corrective price wave counteracts a preceding impulsive move. The primary harmonic retracement metrics used across crypto pairs like BTC/USDT and ETH/USDT are 0.382, 0.50, 0.618, 0.786, and 0.886.When a crypto asset experiences an aggressive rally and pulls back, harmonic traders track these precise percentages to verify structural integrity. For instance, a pullback that stabilizes precisely at the 61.8% mark satisfies the foundational requirement for several foundational structures.
Extensions and projections calculate how far a subsequent price impulse will stretch beyond the boundaries of an established historical swing leg. The dominant harmonic extensions utilized by quantitative automated trading scripts include 1.13, 1.272, 1.414, 1.618, 2.0, 2.24, and 2.618. These numbers are crucial because they project exhaustion targets during parabolic breakouts or sudden liquidation cascades, giving traders exact price targets where buyers or sellers will likely lose momentum.
How Do You Identify the XABCD Harmonic Framework on Crypto Charts?
The fundamental structure of almost every harmonic pattern is the XABCD sequence, a geometric framework tracking five distinct market pivot points that generate four sequential price legs.This framework translates chaotic blockchain order books into an identifiable "M" shape for bullish reversal setups or a "W" shape for bearish reversal setups.Each pivot point must satisfy a rigid algorithmic rule relative to its predecessor, or the entire setup is immediately invalidated.
To map out this blueprint on a live crypto chart, traders follow a standardized multi-step workflow:
-
The XA Leg: This is the initial, highly impulsive trend wave that anchors the entire pattern. It represents a powerful directional move, such as a sudden 15% surge in Bitcoin's price driven by institutional spot inflows.
-
The AB Leg: This represents the first corrective wave against the original trend. It moves in the opposite direction of the XA leg and must terminate at a highly specific Fibonacci retracement level of the XA distance.
-
The BC Leg: This wave reverses direction again, moving in the same path as the primary XA impulse. It traces the corrective path of the AB leg, typically remaining bounded within a 38.2% to 88.6% retracement of the AB wave.
-
The CD Leg: The final, definitive leg of the pattern. It moves counter to the BC wave, extending sharply outward to complete the entire geometric framework at a mathematically calculated zone.
The terminal point of this entire sequence is Point D, commonly referred to in technical analysis as the Potential Reversal Zone (PRZ).The PRZ represents a concentrated cluster of overlapping Fibonacci measurements where the primary XA retracement, the BC extension, and symmetrical structural movements align perfectly. Instead of reacting blindly to a falling knife, a harmonic trader observes the PRZ as a highly calculated geographic coordinate where the asset is mathematically primed to reverse.
What Are the Most Popular Harmonic Patterns in Crypto Trading?
While dozens of geometric variations exist, four specific harmonic configurations dominate cryptocurrency markets due to their historical accuracy and distinct geometric layouts. Automated crypto scanning data released by altFINS in early 2026 confirms that institutional algorithms and retail screeners actively track these four setups across major altcoin pairs.
The Gartley Pattern
Dating back to its original documentation by H.M. Gartley in 1935, this classic configuration remains a bedrock of harmonic theory.The structural legitimacy of a Gartley pattern hinges entirely on two unyielding mathematical rules: Point B must retrace exactly 61.8% of the initial XA leg, and Point D must complete precisely at a 78.6% retracement of that same XA leg.In crypto markets, a bullish Gartley typically signals that a corrective pullback within an overarching macro uptrend has exhausted its selling pressure, offering a high-probability entry right before the dominant bullish trend resumes.
The Bat Pattern
Discovered by Scott Carney in 2001, the Bat pattern is widely celebrated among crypto derivatives traders for its tight risk parameters and deep corrective nature.It is characterized by a shallow Point B retracement, which must stay below 61.8% of the XA leg (typically hitting the 38.2% or 50% levels), followed by a massive, deep drop for the CD leg that terminates exactly at the 88.6% retracement of XA.Because Point D sits incredibly close to the original structural origin at Point X, stop-loss invalidation levels can be placed exceptionally tight, creating an optimal risk-to-reward ratio during volatile market shakeouts.
The Butterfly Pattern
Unlike the Gartley and the Bat, which complete their structures within the historical boundaries of the original XA impulse, the Butterfly is an extension pattern. This means the final CD leg extends aggressively past the initial starting point (Point X). A valid Butterfly pattern requires Point B to form a deep 78.6% retracement of the XA leg, while the action zone at Point D extends outward to hit a 1.272 or 1.618 extension of the XA leg.In crypto, bullish Butterflies are highly effective at catching the exact bottom of capitulation events, where over-leveraged long positions are forced out right before a sharp market rebound.
The Crab Pattern
Another key discovery by Scott Carney, the Crab pattern represents an extreme extension model designed to capture the ultimate boundaries of overextended market trends.The defining trait of a Crab setup is an incredibly volatile CD leg that stretches all the way to a 1.618 extension of the initial XA leg, paired with an extreme BC projection that can reach as high as 3.14 or 3.618.Because crypto assets are prone to dramatic, emotion-driven momentum runs, the Crab pattern helps traders identify the absolute exhaustion point of a parabolic rally, providing an institutional-grade framework for shorting overbought assets.
How to Apply Harmonic Patterns to Volatile Crypto Markets?
Applying harmonic patterns to cryptocurrency trading requires an entirely different execution strategy than traditional equities or foreign exchange markets. Because crypto assets are highly prone to aggressive liquidity sweeps, sudden flash crashes, and exchange-driven liquidation events, trading these setups requires a strict confluence-driven approach to survive.
First, crypto traders must combine harmonic Potential Reversal Zones with structural support and resistance levels.If a pattern's Point D aligns precisely at an 88.6% Fibonacci retracement, its probability of success surges if that exact price coordinates with a major historical order block, a psychological round number, or a rising weekly moving average. Relying solely on a isolated geometric ratio without assessing macro structural context often leads to premature entries during heavy market sell-offs.
Second, tracking volume dynamics and momentum oscillators is essential for validating a reversal at the PRZ. As the price enters the action zone at Point D, traders should look for a clear divergence on the Relative Strength Index (RSI) or the Moving Average Convergence Divergence (MACD). If the price prints a new structural low at Point D while the RSI prints a higher low, it signals that selling pressure is decelerating, providing concrete validation to execute the trade.
Finally, managing risk inside the PRZ requires a structured execution framework. Traders can choose between an aggressive approach—placing automated limit buy or sell orders directly inside the PRZ to catch the exact mathematical turning point—or a conservative approach, which involves waiting for a daily or 4-hour candlestick to print a bullish hammer or engulfing pattern within the zone before entering. Regardless of the entry style, position sizing must be scaled appropriately to account for the digital asset class's standard daily volatility.
What Are the Core Risks and Pitfalls of Harmonic Crypto Trading?
While harmonic pattern recognition provides an incredibly robust structural framework, applying it incorrectly in the digital asset space can lead to swift capital drawdown. Understanding the inherent risks of this methodology is vital for long-term portfolio survival.
| Risk Category | Operational Pitfall | Strategic Mitigation |
| Ratio Flexibility | Forcing imperfect geometric shapes into valid patterns. | Enforce strict algorithmic rules; if a ratio is missed, cancel the trade setup. |
| Parabolic Trends | Shorting strong, news-driven market breakout legs. | Never trade harmonics against a major macroeconomic or regulatory catalyst. |
| Premature Execution | Entering trades before Point D completely forms. | Wait for the price to fully enter the PRZ and print clear reversal confirmation. |
The most common mistake among developing technical analysts is forcing "imperfect" geometry into a recognized harmonic mold. If a pattern looks like a Gartley but its Point B retraces 70% of the XA leg instead of the mandatory 61.8%, it is not a Gartley pattern. Attempting to trade loose variations in cryptocurrency markets invariably results in losses, as automated institutional trading algorithms only execute when exact, rigid mathematical thresholds are triggered.
Another structural threat is the danger of trading against a high-momentum, fundamental-driven breakout. During macro bull runs or systemic crypto events, assets can remain completely decoupled from technical metrics for weeks at a time. A Crab pattern projecting a short entry at a 1.618 extension can easily be obliterated if a massive fundamental catalyst drives a token parabolic. Therefore, harmonic setups should always be utilized as confluence tools within an established risk management framework, rather than standalone crystal balls.
How to Buy or Trade Cryptocurrency Using Harmonic Patterns on KuCoin?
KuCoin provides a world-class trading infrastructure perfectly engineered to handle the precision and execution requirements of harmonic pattern recognition. Whether you prefer manually mapping out XABCD coordinates or deploying fully automated algorithmic configurations, the platform offers a seamless ecosystem designed to optimize your geometric trading strategy.
To get started, create your account on the official KuCoin platform and complete the security verification process to safeguard your funds. Once your account is funded with USDT, USDC, or Bitcoin, navigate directly to the Advanced Trading Interface. KuCoin features fully integrated, state-of-the-art TradingView charting software natively within its portal. This integration gives you immediate access to specialized XABCD pattern tools, automatic Fibonacci retracement layout engines, and customizable drawing systems, enabling you to identify institutional-grade setups across hundreds of spot and futures pairs.
For traders looking to eliminate emotional bias, KuCoin’s advanced order routing system allows for highly exact execution. You can place post-only limit orders directly within a calculated Potential Reversal Zone or set up custom price alerts to notify you the exact second an asset hits its structural Point D. Furthermore, if you want to take your harmonic strategy to the next level, you can connect your KuCoin API keys to automated crypto chart pattern recognition platforms like altFINS. This allows you to automatically scan the top 500 digital assets 24/7 and execute precise, algorithmic reversal trades the moment a geometric pattern reaches mathematical completion.
Conclusion
Harmonic pattern recognition stands out as an elite technical analysis discipline that successfully bridges the gap between raw mathematics and chaotic human psychology. By transforming emotional cryptocurrency market cycles into highly structured geometric frameworks, it empowers traders to replace speculative guesswork with exact mathematical coordinates.Whether you are using a tight-risk Bat pattern to buy an altcoin liquidation cascade or a Crab extension to short an overextended rally, success with this methodology requires absolute discipline, strict adherence to exact Fibonacci ratios, and ironclad risk management protocols. When integrated with KuCoin’s highly responsive trading infrastructure and institutional-grade charting toolsets, harmonic analysis provides a definitive edge, allowing you to confidently map market volatility and execute trades with mechanical precision.
FAQs
Can harmonic patterns be used for short-term crypto scalping?
Yes, harmonic patterns are completely fractal, meaning they form and execute across every single timeframe, from 1-minute and 5-minute scalping charts up to macro weekly timeframes.However, shorter timeframes inherit significantly higher market noise and exchange fee churn, meaning scalpers must demand exact ratio alignment and utilize highly strict confirmation triggers within the PRZ to avoid false breakouts.
Which harmonic pattern is considered the most reliable in crypto trading?
The Bat pattern is widely regarded by digital asset professionals as the most structurally reliable harmonic pattern due to its deep 88.6% XA retracement level.Because Point D completes exceptionally close to the structural origin at Point X, it allows traders to set incredibly tight stop-losses right past the invalidation line, maximizing the overall risk-to-reward ratio while keeping capital exposure minimal.
What is the difference between a Gartley pattern and a Bat pattern?
The core difference lies entirely within their mandatory Point B and Point D Fibonacci retracement ratios. A legitimate Gartley pattern requires Point B to retrace exactly 61.8% of the XA leg and completes at a 78.6% retracement at Point D, whereas a Bat pattern features a shallower Point B retracement (38.2% or 50%) and a much deeper Point D completion at 88.6% of the XA leg.
Where exactly should I place my stop-loss when trading harmonics?
Your stop-loss should always be positioned immediately beyond the structural invalidation point of the specific pattern being traded. For internal patterns like the Gartley and the Bat, the hard invalidation line sits just past the original swing origin at Point X; for external extension patterns like the Butterfly or Crab, the stop-loss is placed just beyond the projected outer boundary of the calculated PRZ.
Do automated tools exist to detect harmonic patterns in cryptocurrency?
Yes, multiple advanced technical analysis suites and charting interfaces feature native algorithms designed to automate harmonic recognition.Platforms like TradingView offer both built-in layout utilities and community-developed scripts that scan live candles, automatically mapping out XABCD legs and highlighting overlapping Fibonacci confluence zones across various crypto pairs in real time.


