
What is Elliott Wave theory in crypto?
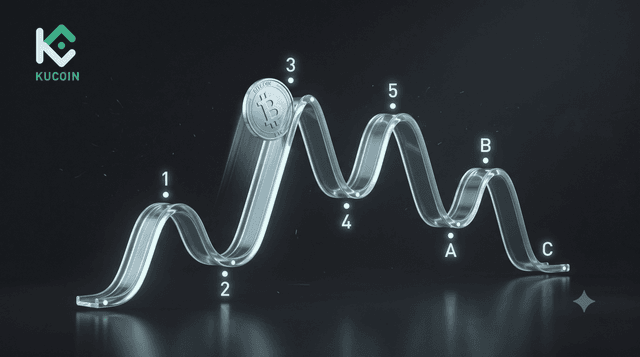
Is the financial market completely random, or is it governed by predictable waves of human emotion? The cryptocurrency market operates in highly synchronized cycles of investor sentiment, transitioning rapidly from extreme greed to panic. Elliott Wave Theory answers this by stating that asset prices do not move in straight lines; instead, they move in repetitive, fractal wave structures that track aggregate market psychology. Originally developed for traditional stock markets, this methodology has become a core system for digital asset trading.
According to market data from Binance Research and CCData in May 2026, the global cryptocurrency market capitalization stands resilient at $2.6 trillion despite localized sector corrections. This massive capital footprint experiences continuous shifts in liquidity, turning technical systems like Elliott Wave Theory into vital tools for predicting trend reversals and price targets. By mapping out specific configurations of impulse and corrective waves, crypto traders can identify where a digital asset sits within its multi-month or intraday cycle. Understanding these natural patterns helps market participants filter out short-term market noise and locate high-probability entries and exits.
What Is the Core Concept Behind Elliott Wave Theory?
The primary principle of Elliott Wave Theory is that market price actions are the direct byproduct of mass human psychology, which naturally fluctuates in alternating patterns of optimism and pessimism. Ralph Nelson Elliott established in the 1930s that financial trends are not erratic but rather follow identifiable, recurring cycles called "waves." According to a historical review by Investopedia, Elliott observed that these structures are fractal, meaning they repeat themselves continuously across different timeframes. A multi-year macro bull run can be broken down into identical, smaller wave structures that manifest on daily, hourly, or even one-minute charts.
In the context of the highly volatile crypto markets, these waves reflect the clear progression of crowd behavior—ranging from early institutional accumulation to public FOMO (Fear of Missing Out), followed by profit-taking and capitulation. Rather than relying purely on isolated news events, Elliott Wave Theory views news as a mere catalyst that accelerates a pre-existing psychological phase. The framework divides all market movements into two fundamental categories: impulse waves that drive the price in the direction of the dominant trend, and corrective waves that pull the price back against that trend.
How Do Impulse Waves Move Crypto Prices?
Impulse waves move cryptocurrency prices upward during a bull market or downward during a bear market through a highly structured sequence of five distinct sub-waves. According to the foundational crypto trading guides published by Bitstamp, this phase is universally classified as a "5-wave pattern" where waves 1, 3, and 5 represent the primary motive power driving the trend, while waves 2 and 4 serve as temporary structural pullbacks.
To properly identify a valid Elliott Wave impulse structure in any cryptocurrency asset, traders must strictly monitor three golden rules:
-
Rule 1: Wave 2 can never retrace more than 100% of the price territory covered by Wave 1.
-
Rule 2: Wave 3 is mathematically incapable of being the shortest of the three motive waves (Waves 1, 3, and 5), and it is very frequently the longest and most explosive leg.
-
Rule 3: Wave 4 must never enter or overlap with the price territory established by the peak of Wave 1.
The progression of these five waves maps out a predictable narrative of market adoption. Wave 1 triggers a subtle price increase when a small group of contrarian buyers enters near a macro bottom. Wave 2 occurs as early participants take profits, causing a sharp but partial price retracement. Wave 3 materializes when the broader public recognizes the breakout, fueling a massive surge in trading volume and capital inflows. Wave 4 presents a complex, sideways consolidation where late buyers absorb profit-taking from institutional players. Finally, Wave 5 represents the ultimate phase of retail FOMO, pushing the cryptocurrency asset to an overextended, speculative peak right before the trend completely exhausts itself.
How Do Corrective Waves Form in Crypto Markets?
Corrective waves form immediately following the completion of a five-wave impulse sequence, acting as a structural mechanism that cools off overbought or oversold conditions through a three-wave counter-trend movement. Based on data from technical manuals provided by Bitstamp, these formations are labeled alphabetically as a "3-wave ABC pattern." While the primary impulse phase builds up market momentum over five stages, the corrective phase works to rebalance the market, moving sharply against the macro direction via Waves A, B, and C.
Market psychology during a correction is notoriously deceptive for inexperienced retail traders. Wave A initiates the decline, though many participants mistakenly view it as a minor, healthy dip within an ongoing bull market. Wave B marks a defensive, low-volume rally that attempts to revisit the previous peak, but it ultimately fails to set a new high as buying exhaustion settles in. Wave C delivers the final, decisive blow to market sentiment, plunging below the low established by Wave A and triggering a wave of retail liquidations and panic selling.
According to advanced technical documentation by CMC Markets, corrective waves do not always manifest as straightforward downward channels; instead, they generally organize into four core structural types:
-
Zigzags: Sharp, aggressive counter-trend movements where Wave B fails to recover significantly, resulting in deep, steep price drops.
-
Flats: Sideways, range-bound consolidations where Waves A, B, and C are roughly equal in length, signaling a balanced tug-of-war between buyers and sellers.
-
Triangles: Five-sub-wave structures (labeled A-B-C-D-E) bound by converging or diverging trendlines that temporarily compress asset volatility.
-
Combinations: Highly complex, irregular patterns where flats, zigzags, and triangles merge to form prolonged sideways ranges that frustrate active market participants.
Why Do Fibonacci Ratios Matter to Elliott Wave Analysis?
Fibonacci ratios provide the precise mathematical measurements required to forecast the exact price levels where Elliott Waves will likely begin, stall, or completely reverse. According to a technical analysis report published by Elliott Wave Forecast in May 2026, wave counting alone is insufficient without quantitative mathematical verification. Traders combine wave structures with Fibonacci retracement and extension tools to identify high-probability inflections. Because crowd psychology naturally scales in geometric proportions, the relationships between different wave lengths frequently mirror key Fibonacci numbers like 0.382, 0.50, 0.618, and 1.618.
During a trending market, Fibonacci retracements are heavily utilized to pinpoint the exact completion points of corrective moves. For instance, Wave 2 typically pulls back to the 50% or 61.8% Fibonacci retracement level of Wave 1, offering an optimal entry point for traders anticipating the next leg up. Wave 4 is generally shallower, often finding support at the 23.6% or 38.2% Fibonacci retracement level of the massive Wave 3.
When it comes to mapping out profit targets, Fibonacci extensions are critical for projecting the heights of motive moves. Wave 3 frequently extends precisely to the 161.8% or 261.8% extension level of Wave 1, while Wave 5 often matches the length of Wave 1 or extends to a 61.8% projection of the entire distance traveled from Wave 1 through Wave 3.
What Are the Challenges of Using Elliott Wave in Crypto?
The primary challenge of applying Elliott Wave Theory to cryptocurrency charts is the highly subjective nature of counting waves in real-time, which often leaves traders vulnerable to confirmation bias and conflicting interpretations. While looking at a completed historical chart makes wave identification appear straightforward, active markets present multiple valid interpretations simultaneously. A trader might confidently label an aggressive price surge as the start of an explosive Wave 3, only to watch the market break structural rules and realize it was merely a complex Wave B correction within a prolonged bear market.
Additionally, the inherent volatility and fragmented liquidity of the cryptocurrency landscape can cause frequent structural anomalies. Sudden external events—such as unexpected regulatory policy changes, flash-loan smart contract exploits, or localized macroeconomic shocks—can trigger extreme, short-term wick deviations. According to data compiled by CoinDesk on centralized spot and derivatives trading volumes in April 2026, aggregate market volumes decreased by 11.7% to $4.61 trillion, highlighting that lower liquidity periods can exacerbate random, erratic price wicks. These sudden spikes can violate Elliott Wave rules on lower timeframes, forcing technical analysts to completely invalidate their existing wave counts and restructure their entire trading thesis.
How Can Traders Combine Elliott Waves with Other Tools?
Traders can dramatically increase the accuracy of Elliott Wave analysis by pairing wave structures with momentum oscillators and volume profiles to mathematically confirm structural shifts. According to empirical studies detailed by Elliott Wave Forecast in May 2026, relying solely on visual wave tracking leaves an analyst exposed to market noise. To mitigate this risk, professional technical traders implement the Elliott Wave Oscillator (EWO) or the Relative Strength Index (RSI) to monitor underlying market momentum.
During an ideal five-wave impulse sequence, the Elliott Wave Oscillator will consistently print its absolute highest readings during the peak of Wave 3, providing definitive mathematical confirmation of trend acceleration. When Wave 5 pushes the cryptocurrency to a marginal new price high, the RSI will very frequently print a much lower high, forming a distinct bearish divergence. This divergence serves as a reliable early warning system that buying momentum is fully exhausted and a severe ABC correction is imminent.
Furthermore, integrating volume profiles allows traders to verify transitions; true impulse waves must always be accompanied by expanding trading volume, whereas corrective waves should exhibit a noticeable contraction in overall market participation.
How to Trade Crypto Using Elliott Wave Theory on KuCoin?
Executing an Elliott Wave trading strategy on KuCoin requires a structured approach centered around key invalidation levels, strict stop-loss management, and advanced charting tools. KuCoin's comprehensive trading interface provides full access to built-in Fibonacci retracement tools, extension overlays, and momentum oscillators, allowing you to seamlessly map out multi-timeframe wave counts across thousands of spot and futures pairs.
To implement an actionable Elliott Wave strategy on KuCoin, follow this systematic workflow:
-
Identify the Macro Trend: Open a higher-timeframe chart, such as the 4-hour or 1-day view, to determine if the asset has completed a macro ABC correction and is entering a brand-new Wave 1 impulse.
-
Wait for Wave 2 Retracement: Do not chase the initial breakout. Allow Wave 1 to peak, and monitor the subsequent Wave 2 pullback as it approaches the 50% or 61.8% Fibonacci retracement level.
-
Set a Precise Entry and Stop-Loss: Place a limit buy order within the Fibonacci golden zone. Because Elliott Wave Rule 1 dictates that Wave 2 can never retrace below the absolute origin of Wave 1, place your stop-loss order slightly below the start of Wave 1 to ensure a tight, low-risk invalidation point.
-
Project Wave 3 Profit Targets: Once your position is filled and Wave 3 accelerates, plot a Fibonacci extension tool from the bottom of Wave 1 to its peak, and down to the bottom of Wave 2. Set scale-out take-profit targets at the 161.8% and 261.8% extension levels.
-
Manage Your Position with KuCoin Trading Bots: To remove emotional bias during choppy Wave 4 consolidations or volatile Wave 5 extensions, deploy a KuCoin Infinity Grid or Smart Rebalance bot to automatically capture fluctuations while locking in profits as price targets are hit.
Conclusion
Elliott Wave Theory serves as an exceptionally powerful diagnostic framework for cryptocurrency traders seeking to decode the underlying psychological cycles that dictate market price action. By categorizing complex market charts into structured five-wave impulse progressions and three-wave corrective channels, the theory transforms chaotic market behavior into highly readable, actionable patterns. When utilized correctly alongside rigid mathematical tools like Fibonacci retracements and momentum indicators, Elliott Wave analysis allows traders to accurately project upcoming market reversals, locate conservative entry points, and lock in profits at major structural extensions.
However, trading success with Elliott Wave requires consistent practice, emotional discipline, and an understanding that the framework provides probabilities rather than absolute certainties. The volatile nature of the crypto asset class means that structural invalidations will occur. Market participants must protect their trading capital by applying strict stop-loss protocols at key invalidation levels. By combining advanced wave structures with the deep liquidity and precision charting tools available on KuCoin, you can confidently navigate shifting market cycles and significantly improve your long-term trading consistency.
FAQs
Can Elliott Wave Theory be applied to meme coins?
Yes, Elliott Wave Theory can technically be applied to meme coins, but its reliability decreases significantly due to the lower liquidity and extreme, sentiment-driven volatility inherent to those assets. Because meme coins are highly susceptible to isolated social media catalysts and sudden whales entering or exiting positions, their price actions frequently create severe, irregular wicks. These sudden spikes regularly breach the strict structural rules of impulse and corrective waves, making clean wave counting highly unreliable on lower timeframes.
What happens if a cryptocurrency price breaches an Elliott Wave rule?
If a cryptocurrency price breaches any of the three golden rules of Elliott Wave Theory, the current wave count is immediately invalidated. When an invalidation occurs, the trader must delete their existing wave labels and re-analyze the chart from a fresh perspective to establish an alternative wave count. This strict invalidation mechanism is highly beneficial, as it provides a clear, objective signal that your market thesis was incorrect, allowing you to exit a failing trade early to preserve capital.
Which timeframe is best for Elliott Wave crypto trading?
The 4-hour and 1-day charts are widely considered the most effective timeframes for identifying reliable Elliott Wave structures in cryptocurrency markets. Higher timeframes naturally smooth out erratic intraday price noise and localized liquidations, making it much easier to spot valid 5-wave impulse trends and 3-wave ABC corrections. Once a macro wave count is established on higher timeframes, traders can zoom into the 15-minute or 1-hour charts to optimize their execution entries.
Is Wave 3 always the longest wave in a crypto bull run?
Wave 3 is not mathematically required to be the absolute longest wave, but it can never be the shortest of the three motive waves (Waves 1, 3, and 5). In cryptocurrency markets, however, Wave 3 is overwhelmingly the longest and most explosive phase of the cycle. This occurs because the massive influx of retail FOMO and institutional capital accumulation typically occurs simultaneously during this phase, driving sharp, parabolic price expansions.
What is the difference between an impulse wave and a corrective wave?
An impulse wave moves price powerfully in the direct path of the dominant macro trend using a structured five-wave sequence, while a corrective wave moves against the main trend via a three-wave configuration. Impulse waves are characterized by expanding trading volume, high momentum, and rapid price progress. In contrast, corrective waves are generally characterized by contracting volume, choppy sideways or downward distributions, and complex, deceptive consolidation patterns.


