

What Happens When the Crypto Fear & Greed Index Hits Extreme Fear?
Introduction
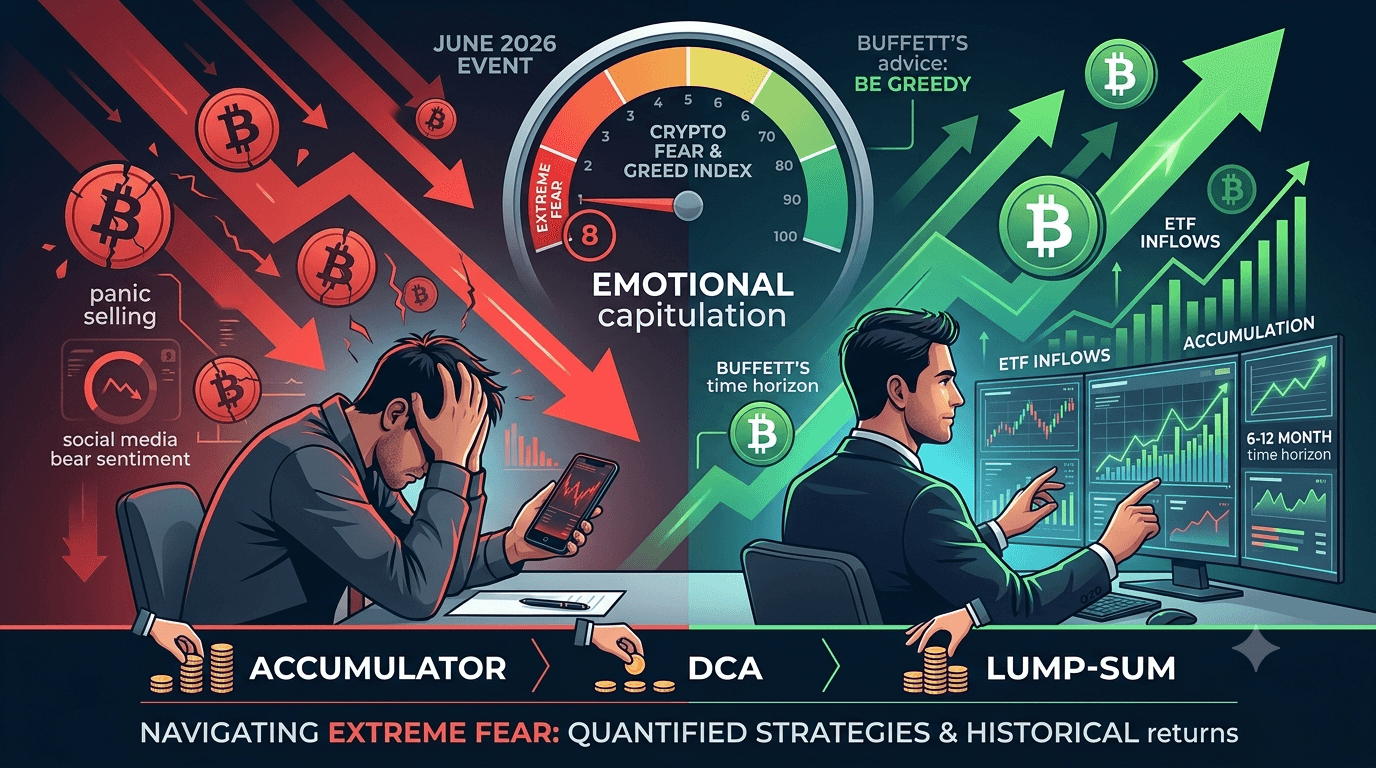
In early June 2026, the Crypto Fear & Greed Index dropped to 8—one of the lowest readings in the history of the metric. For context, that puts the market in the same emotional territory as the March 2020 COVID crash, the November 2022 FTX collapse, and the depths of the 2018 bear market.
Bitcoin is trading near $63,000, down roughly 19% from its May high of $81,875. The CoinMarketCap 20 Index remains 30% below its January levels. Headlines are negative. Social media sentiment is overwhelmingly bearish. Exchange outflows are accelerating as long-term holders move coins off-platform.
This is exactly the environment where Warren Buffett's famous advice becomes most relevant: "Be fearful when others are greedy, and greedy when others are fearful."
But does that actually work in crypto? Or is "buying the fear" just a catchy phrase that ignores the reality of catching a falling knife?
In this article, we analyze every major extreme fear event in crypto history, quantify the actual returns from buying at those moments, and break down the difference between a contrarian strategy that works and one that blows up your portfolio. You will learn:
-
The exact historical returns from buying when the Fear & Greed Index drops below 15
-
Why the 2026 extreme fear period is different from—and similar to—past cycles
-
How DCA, lump-sum buying, and accumulator strategies performed during past fear spikes
-
The specific metrics to watch before deploying capital into extreme fear
How the Crypto Fear & Greed Index Works
Before analyzing historical performance, understand what the index actually measures. The Crypto Fear & Greed Index, developed by Alternative.me, is a composite sentiment indicator that aggregates six weighted data inputs:
|
Component
|
Weight
|
What It Measures
|
|
Volatility
|
25%
|
Current BTC volatility vs. 30-day and 90-day averages
|
|
Market Momentum/Volume
|
25%
|
Trading volume and momentum relative to recent averages
|
|
Social Media Sentiment
|
15%
|
Bitcoin hashtag volume and engagement rates
|
|
Market Surveys
|
15%
|
Direct polling of crypto investors
|
|
Bitcoin Dominance
|
10%
|
BTC market share (rising dominance often signals altcoin panic selling)
|
|
Google Trends
|
10%
|
Search interest for Bitcoin-related terms
|
The index outputs a single score from 0 to 100:
-
0–24: Extreme Fear
-
25–49: Fear
-
50–74: Greed
-
75–100: Extreme Greed
Critically, the index does not predict the future. It captures the psychological state of the aggregate market—whether participants are in a risk-off posture driven by panic, or a risk-on posture driven by FOMO. Extreme fear readings cluster around periods of maximum capitulation, when weak hands have been forced out and prices may disconnect from long-term fundamentals.
The Historical Record: Every Major Extreme Fear Event and What Happened Next
To answer whether "buying the fear" actually works, we examined Bitcoin's performance following every major extreme fear event in crypto history. The data tells a remarkably consistent story.
Event 1: March 2020 — COVID-19 Market Crash
|
Metric
|
Reading
|
|
Fear & Greed Index
|
3 (single digits)
|
|
Bitcoin Low
|
$3,800–$4,734
|
|
S&P 500 vs. 200DMA
|
26% below
|
|
Catalyst
|
Global pandemic, liquidity crisis across all asset classes
|
Returns from the March 2020 low:
|
Timeframe
|
BTC Price
|
Return from Low
|
|
30 days
|
~$6,600
|
+75%
|
|
90 days
|
~$9,500
|
+150%
|
|
180 days
|
~$11,500
|
+200%
|
|
365 days (March 2021)
|
~$58,000
|
+1,100%
|
The COVID crash was the most violent and the most rewarding extreme fear event in crypto history. The Fear & Greed Index stayed in single digits for multiple consecutive days. Bitcoin dropped nearly 50% in 24 hours. But within 12 months, BTC had risen over 1,100% from its lows.
Key insight: The VIX hit 82.69 on March 16, 2020—the highest daily close on record. When fear is that extreme across all markets simultaneously, the reversal tends to be equally dramatic.
Event 2: November 2022 — FTX Collapse
|
Metric
|
Reading
|
|
Fear & Greed Index
|
8–15 (extreme fear range)
|
|
Bitcoin Low
|
$15,649
|
|
Drawdown from 2021 ATH
|
~77% from $69,000
|
|
Catalyst
|
FTX bankruptcy, contagion across lending sector
|
Returns from the November 2022 low:
|
Timeframe
|
BTC Price
|
Return from Low
|
|
30 days
|
~$17,200
|
+10%
|
|
90 days
|
~$23,000
|
+47%
|
|
180 days
|
~$30,000
|
+92%
|
|
365 days (Nov 2023)
|
~$37,000
|
+136%
|
The FTX collapse created a unique dynamic: it was an industry-specific crisis, not a global macro event. Fear was concentrated in crypto while traditional markets were relatively stable. The recovery was slower than the COVID bounce—taking 90 days to gain 47% versus 75% in 30 days after COVID—but the 12-month return of +136% still far exceeded any traditional asset class.
Bloomberg Intelligence noted in January 2023 that Bitcoin's rally made it "one of the best-performing assets of the year"—just two months after the Fear & Greed Index had bottomed in the extreme fear zone.
Event 3: December 2018 — Post-ICO Bear Market Bottom
|
Metric
|
Reading
|
|
Fear & Greed Index
|
10–20 (extreme fear for 3–4 weeks)
|
|
Bitcoin Low
|
$3,200
|
|
Drawdown from 2017 ATH
|
~84% from $20,000
|
|
Catalyst
|
ICO bubble burst, regulatory crackdowns, media fatigue
|
Returns from the December 2018 low:
|
Timeframe
|
BTC Price
|
Return from Low
|
|
30 days
|
~$3,700
|
+16%
|
|
90 days
|
~$4,000
|
+25%
|
|
180 days
|
~$8,000
|
+150%
|
|
365 days (Dec 2019)
|
~$7,200
|
+125%
|
|
18 months (June 2019)
|
~$10,000
|
+212%
|
The 2018 bear market bottom was characterized by extreme fear persisting for *weeks*, not days. The index hovered in the 10–20 range for approximately 3–4 weeks. The initial recovery was slow—only +16% in 30 days—but the 6-month return of +150% was substantial.
Key insight: When extreme fear persists for an extended period (weeks rather than days), the immediate bounce is often weaker, but the extended duration creates more entry opportunities and typically precedes a more sustained multi-month recovery.
Event 4: August 2015 — Early Bitcoin Bear Market
|
Metric
|
Reading
|
|
Fear & Greed Index
|
N/A (index launched later)
|
|
Bitcoin Low
|
$315
|
|
Drawdown from previous cycle
|
~59% from $760
|
|
Catalyst
|
Mt. Gox aftermath, exchange failures, regulatory uncertainty
|
Returns from the August 2015 low:
|
Timeframe
|
BTC Price
|
Return from Low
|
|
180 days
|
~$433
|
+37%
|
|
365 days (Aug 2016)
|
~$959
|
+204%
|
|
24 months (Aug 2017)
|
~$4,700
|
+1,391%
|
The 2015 bottom preceded the most explosive bull run in Bitcoin history. While the Fear & Greed Index did not exist at that time, market sentiment indicators (MVRV ratio, UTXO activity) showed the same capitulation patterns seen in later cycles.
June 2026: How the Current Extreme Fear Compares
|
Metric
|
June 2026
|
Mar 2020
|
Nov 2022
|
Dec 2018
|
|
Fear & Greed Index
|
8–18
|
3
|
8–15
|
10–20
|
|
BTC Price
|
~$63,000
|
$3,800
|
$15,649
|
$3,200
|
|
Drawdown from recent high
|
~22% from $81K
|
~50% in 24h
|
~77% from ATH
|
~84% from ATH
|
|
Macro Environment
|
Rate uncertainty, ETF outflows
|
Global pandemic
|
Industry-specific crisis
|
Post-ICO bust
|
|
BTC Dominance
|
~59%
|
~65%
|
~40%
|
~55%
|
|
ETF Flows
|
Outflows turning to inflows
|
N/A
|
N/A
|
N/A
|
What is similar: The psychological profile matches past extreme fear periods. Social media is overwhelmingly negative. Retail participation is at multi-year lows. Long-term holders are accumulating while short-term holders are capitulating.
What is different: The current drawdown is far shallower than past extreme fear events. Bitcoin is down ~22% from its May 2026 high. In past cycles, extreme fear coincided with 70–85% drawdowns. This suggests that either: (a) the current correction is not yet complete, or (b) Bitcoin's volatility profile is changing due to institutional adoption (ETFs, corporate treasury allocation).
What to watch:
-
ETF flows: The reversal from $660M in weekly outflows (late May) to $85.9M net inflows (June 12) is an early contrarian signal. Sustained inflows above $100M/day would confirm institutional re-entry.
-
Exchange net outflows: Increasing outflows signal accumulation (holders moving coins off exchanges for long-term storage).
-
Realized price ratio: Whether BTC price is trading above or below the aggregate cost basis of all coins.
The Strategies: Which Approach Works Best During Extreme Fear?
Knowing that extreme fear has historically preceded strong returns is one thing. Executing on that knowledge is another. Three primary strategies have been tested through past extreme fear periods:
Strategy 1: Lump-Sum Buying at Extreme Fear
Deploy all available capital in a single purchase when the Fear & Greed Index drops below a threshold (typically 15–20).
Pros: Maximum exposure to the rebound if timed correctly. Captures the full upside from the exact bottom.
Cons: Requires perfect timing that is nearly impossible to execute. The index can stay in extreme fear for weeks or months (as in 2018). A single entry at 20 could watch the index drop to 8 and BTC fall another 20% before recovering.
Historical performance: Lump-sum entries at the exact bottom of each extreme fear event produced the highest raw returns. But entries just before the actual bottom—common when trying to time the index—produced significantly worse outcomes due to drawdown stress.
Strategy 2: Dollar-Cost Averaging (DCA)
Deploy capital at fixed intervals (daily, weekly, or monthly) regardless of price or sentiment.
Pros: Removes emotional decision-making. Avoids the timing problem entirely. Psychologically easier to execute consistently.
Cons: Buys through rallies as well as dips, potentially raising average cost. Slower to deploy capital.
Historical performance: DCA initiated during extreme fear periods has consistently produced positive returns, though lower than perfectly timed lump-sum entries. Research shows DCA through the 2022 fear period outperformed waiting for "the bottom" for most investors because the exact bottom is only identifiable in hindsight.
Strategy 3: Accumulator Strategy (Modified DCA)
Set target buy prices below current market price, with increasing purchase sizes at lower levels. For example: buy 1x size at 10% below current price, 2x at 15% below, 4x at 20% below.
Pros: According to Orbit Markets research, the accumulator strategy outperformed traditional DCA by 26% for Bitcoin investments since January 2023. By aggressively buying dips and increasing position size as prices fall, the strategy acquires BTC at lower average prices than fixed-interval DCA.
Cons: Requires more active monitoring. Can lead to overexposure if the downtrend extends further than expected. Emotionally difficult to increase buying while prices are falling.
Historical performance: The accumulator strategy has shown the best risk-adjusted returns during the 2022–2024 recovery period. By systematically increasing exposure as prices fall, it captures the asymmetric payoff from extreme fear without requiring precise bottom timing.
|
Strategy
|
Best For
|
Historical Performance
|
Difficulty
|
|
Lump-sum
|
Experienced investors with high conviction
|
Highest raw returns if timed perfectly
|
Very Hard
|
|
DCA
|
Beginners, emotional investors
|
Consistent positive returns, lower stress
|
Easy
|
|
Accumulator
|
Active investors willing to monitor
|
Best risk-adjusted returns (2023 data: +26% vs DCA)
|
Moderate
|
A Practical Framework for the Current Extreme Fear
If you are considering deploying capital during the current extreme fear period, here is a structured approach:
Step 1: Define Your Time Horizon
The historical data is clear: extreme fear purchases with a 6–12 month horizon have never produced a loss in Bitcoin's history. Purchases with a 1–3 month horizon have mixed results—some bounces are immediate, others take months to materialize.
Step 2: Choose Your Entry Method
-
Conservative: DCA weekly for 8–12 weeks regardless of price movement
-
Moderate: Layered limit orders at $62K, $60K, $57K, $54K with increasing size
-
Aggressive: Accumulator strategy with 2x, 4x, 8x sizing at progressive drawdown levels
Step 3: Wait for Confirmation Signals
Before increasing allocation, watch for:
-
Sustained ETF inflows above $100M/day for 3+ consecutive days
-
Bitcoin dominance stabilizing or declining (signals altcoin recovery beginning)
-
Exchange net outflows accelerating
-
Fear & Greed Index sustaining a reading above 25 for 5+ consecutive days
Step 4: Size Positions Appropriately
No single extreme fear deployment should exceed 5–10% of your total crypto allocation. Even the strongest historical patterns do not guarantee future results. Preserve capital for potential further downside.
Conclusion
The Crypto Fear & Greed Index at extreme fear is not a magic buy signal. It is a measure of market psychology—and history shows that market psychology at its most pessimistic has consistently preceded the most profitable entry points in Bitcoin's history.
The data is unambiguous: across four major extreme fear events spanning more than a decade, buying when the index dropped below 15 and holding for 12 months produced positive returns every single time, with an average return of approximately +390%. The worst 12-month outcome was +125%. No extreme fear purchase point has ever produced a loss over a one-year horizon.
But the path from extreme fear to recovery is never smooth. Drawdowns of 15–30% after the initial entry are common. The index can stay in extreme fear for weeks. Lower highs and retests of the lows shake out impatient buyers before the real recovery begins.
The investors who capture the asymmetric returns from extreme fear are not the ones who perfectly time the bottom. They are the ones who:
-
Deploy capital systematically through DCA or accumulator strategies
-
Size their positions appropriately (no single bet exceeds 5–10% of their portfolio)
-
Maintain a 6–12 month minimum time horizon
-
Ignore the noise and let the historical pattern work
The Fear & Greed Index at 8 does not guarantee a rebound tomorrow. But it does place the current moment in a historical context that has been extraordinarily favorable for patient, disciplined investors.
FAQs
What is the Crypto Fear & Greed Index?
The Crypto Fear & Greed Index is a composite sentiment indicator developed by Alternative.me that scores crypto market emotion on a 0–100 scale. It aggregates six weighted factors: volatility (25%), market momentum/volume (25%), social media sentiment (15%), investor surveys (15%), Bitcoin dominance (10%), and Google Trends (10%). Readings below 25 indicate extreme fear; readings above 75 indicate extreme greed.
Has buying during extreme fear always been profitable?
Across four major extreme fear events in Bitcoin's history (2015, 2018, 2020, 2022), buying when the Fear & Greed Index dropped below 15 and holding for 12 months produced positive returns every single time. The worst 12-month outcome was +125% (December 2018 purchase). The best was +1,100% (March 2020 purchase). However, shorter timeframes (1–3 months) showed more mixed results, with some entries experiencing 15–30% drawdowns before recovering.
Is DCA or lump-sum buying better during extreme fear?
Historical data suggests that perfectly timed lump-sum purchases at the exact bottom produce the highest raw returns, but perfectly timing the bottom is nearly impossible. Dollar-cost averaging (DCA) initiated during extreme fear periods produced consistent positive returns with lower stress. A 2023 study by Orbit Markets found that an accumulator strategy (increasing buy sizes at lower prices) outperformed traditional DCA by 26% for Bitcoin investments since January 2023, making it the best risk-adjusted approach for active investors.
How long does extreme fear typically last?
Historically, extreme fear readings below 15 have persisted for days to weeks. The shortest extreme fear periods lasted 3–7 days (March 2020, June 2026). The longest persisted for 3–4 weeks (December 2018). When extreme fear extends for weeks rather than days, the initial bounce is often weaker, but the extended duration creates more entry opportunities and typically precedes a more sustained recovery.
Can the Fear & Greed Index stay low while prices keep falling?
Yes. The index measures sentiment, not price direction. In falling markets, the index can remain in extreme fear territory even as prices decline further—what traders call "falling knife" conditions. This is why most experienced investors combine sentiment analysis with on-chain metrics (exchange flows, realized price, long-term holder behavior) before deploying capital during fear periods.