

Crypto Fear & Greed Index Hits 74 After Bitcoin Tops $80K: Is the Rally Getting Overheated?
2026/08/27 17:36:00
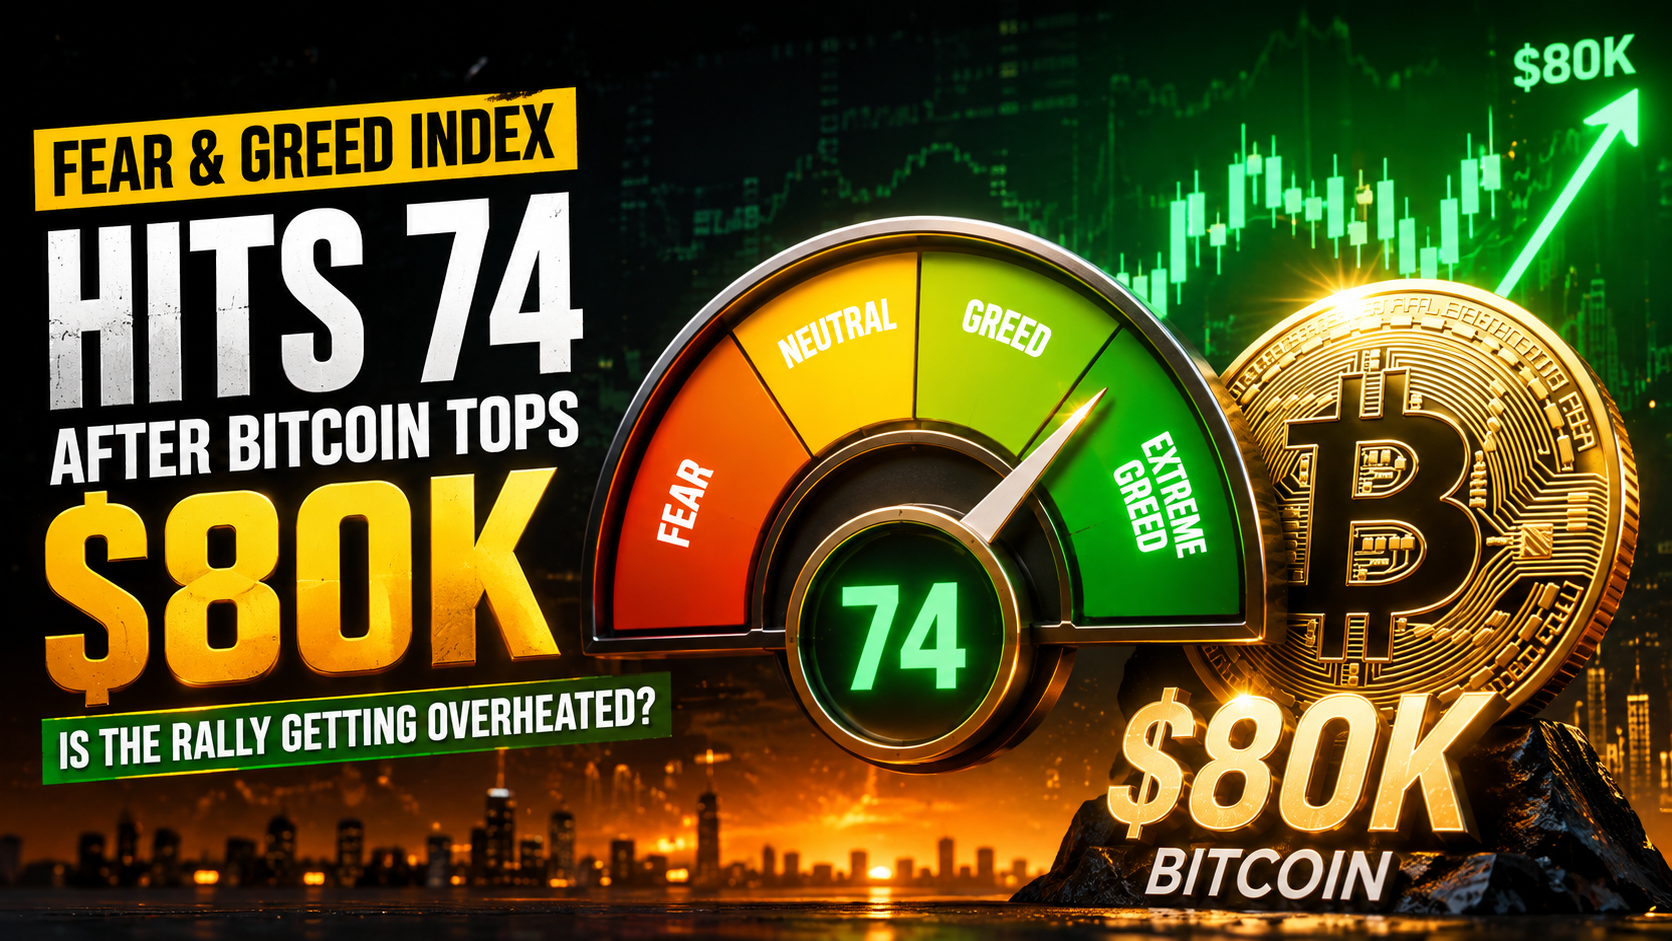
Bitcoin’s return above $80,000 has transformed crypto market sentiment at remarkable speed. The Crypto Fear & Greed Index climbed to 74 on August 25, up from just 27 on August 12, putting the market only one point below the commonly used Extreme Greed threshold. The shift followed a powerful Bitcoin rebound supported by improving macro liquidity expectations, a historic wave of short liquidations and continued demand for U.S. spot Bitcoin ETFs.
The surge has also revived an uncomfortable question: has optimism already turned into excessive speculation? There are clear signs of FOMO, from rapidly rising altcoins to renewed memecoin activity and bullish options bets. Yet Bitcoin’s derivatives market tells a more complicated story. Futures open interest has fallen rather than exploded, while funding rates remain relatively moderate. The market is getting greedier, but that does not necessarily mean it has reached a leverage-driven euphoric top.
Bitcoin Tops $80K as Fear Turns Into Greed
Bitcoin’s latest rally developed with unusual speed. After trading below $68,000 in the previous week, BTC accelerated through several major price levels and briefly moved above $80,000. By August 26, Bitcoin had gained roughly 23% over seven days before profit-taking brought the Bitcoin price back toward $79,000. The rolling weekly gain has since narrowed as the measurement window moved forward.
Market sentiment changed even faster. Alternative.me’s Fear & Greed Index was at 27 on August 12, firmly in Fear territory, but reached 74 on August 25. CoinDesk noted that the market had spent much of late July through August 19 in fear, including a reading of 25 in early August. In less than two weeks, caution was replaced by aggressive risk-taking.
| Market Indicator | Earlier in August | Recent Rally |
| Crypto Fear & Greed Index | 27 — Fear | 74 — Greed |
| Bitcoin price | Below $68K | Above $80K |
| Market mood | Defensive | Risk-on |
| Altcoin activity | Relatively weak | Broadly stronger |
That shift is bullish while buyers remain in control, but it also makes the market more sensitive to disappointment. The faster investors move from fear to FOMO, the more important it becomes to distinguish genuine demand from speculative excess.
What Does a Crypto Fear & Greed Index of 74 Mean?
The Crypto Fear & Greed Index compresses several measures of market behavior into a score between zero and 100. A reading near zero represents extreme fear, while readings near 100 indicate extreme greed. A score of 74 is generally classified as Greed, sitting just below the 75 level commonly associated with Extreme Greed.
Alternative.me says the index currently focuses primarily on Bitcoin and combines several factors. Volatility and market momentum or volume each carry a 25% weighting, social media activity accounts for 15%, Bitcoin dominance for 10%, and Google Trends data for another 10%. A survey component was originally assigned 15% but is currently paused. Importantly, the index is not a poll showing that “74% of investors are greedy.” It is a composite sentiment score based on observed market behavior.
This distinction matters because Fear & Greed is best treated as a context indicator, not a price forecast. Alternative.me itself explains that rising greed can signal an increased risk of correction, but a high score does not tell investors exactly when a market top will occur. Strong bull markets can remain greedy for extended periods while prices continue to rise.
Why Did Bitcoin Break Above $80K?
The rally began with a significant shift in the macro backdrop. On August 19, the U.S. Treasury announced that it would at least double the maximum size of liquidity-support buybacks for longer-dated nominal Treasury securities. Operations in the 10-to-20-year and 20-to-30-year sectors will increase from a maximum of $2 billion to at least $4 billion per operation beginning September 9.
This was not quantitative easing and did not involve the Federal Reserve directly purchasing Bitcoin or injecting money into crypto markets. The transmission mechanism was more indirect. Markets interpreted the Treasury’s action as an effort to improve liquidity in stressed long-duration bonds and limit pressure on yields. Reuters reported that softer yields and a weaker dollar helped revive demand for alternative assets such as Bitcoin and gold, while concerns about currency debasement also strengthened the appeal of scarce assets.
Once Bitcoin started rising, the move was amplified by a massive short squeeze. Nearly $2.7 billion of bearish crypto positions were liquidated in a 24-hour period around the initial breakout, with shorts accounting for roughly 92% of liquidations. Closing a short position requires buying back the asset, so rising prices forced bearish traders to become buyers, adding fuel to the rally.
Bitcoin ETF Inflows Are Supporting the Rally
A short squeeze can accelerate a rally, but it cannot sustain one indefinitely. Once heavily positioned short sellers have been forced out, the market needs another source of demand. That is why the behavior of U.S. spot Bitcoin ETFs has become one of the most important signals behind the move above $80,000.
U.S.-listed spot Bitcoin funds recorded about $337.6 million of net inflows on August 24, extending their inflow streak to seven consecutive trading sessions. Those seven sessions brought more than $2.5 billion into the funds. The following day, another approximately $314 million entered the products, pushing August net inflows above $3 billion.
This gives the rally a more durable source of demand than forced short covering alone. ETF inflows do not guarantee that Bitcoin will rise every day—existing holders can still sell, macro conditions can deteriorate and derivatives positioning can change—but persistent institutional demand makes the market structure different from a rally driven purely by leverage and FOMO.
Why Is the Crypto Market Getting So Greedy?
Fear & Greed has risen because the rally is no longer confined to Bitcoin. Once BTC moved through key resistance levels, investors began taking greater risks across the crypto market. Large-cap assets strengthened, while some smaller and more speculative tokens produced much larger percentage gains.
CoinDesk reported that Dogecoin gained roughly 24% over one seven-day period while several thinly traded memecoins posted triple-digit gains. Thinking Cat rose around 131%, Cash Cat about 113%, and Dog (Bitcoin) nearly doubled. These assets are very different from Bitcoin in liquidity, market capitalization and risk profile, but their performance illustrates an important sentiment shift: capital is moving further out along the risk curve.
That process often follows a recognizable sequence. Investors first regain confidence in Bitcoin, then move toward major altcoins, and eventually begin chasing highly speculative assets as fear of missing out increases. This does not automatically signal a market top, but broad enthusiasm for low-liquidity tokens is a more meaningful sign of speculative appetite than a high Fear & Greed score by itself.
Is Bitcoin Becoming Overleveraged?
This is where the current rally becomes more interesting. A 20%-plus weekly Bitcoin gain combined with a Fear & Greed reading near Extreme Greed would normally raise expectations that traders are aggressively adding leveraged long positions. The available futures data does not show that classic pattern.
Glassnode data cited by CoinDesk showed Bitcoin-denominated futures open interest falling to approximately 587,584 BTC, its lowest level in almost five months and well below the roughly 645,760 BTC recorded on August 14. At the same time, annualized perpetual futures funding rates remained below about 10%, suggesting bullish positioning was present but not yet exceptionally expensive or crowded.
The combination is important. Bitcoin price rose while futures open interest fell. Rather than traders simply building an enormous new leveraged-long position, a significant part of the rally involved existing shorts being closed or liquidated. CoinDesk also reported that crypto-margined futures exposure had dropped to historically low levels, with cash-backed collateral playing a larger role. That does not eliminate downside risk, but it makes the structure less fragile than a rally built primarily on rapidly expanding leverage.
What Are the Real Signs of an Overheated Crypto Market?
A genuinely overheated market usually involves several risk indicators deteriorating at the same time. High sentiment is one piece, but leverage, funding costs, spot demand and speculative rotation matter just as much.
| Indicator | Healthier Rally | Overheated Rally |
| Fear & Greed | Elevated but stable | Persistently extreme |
| ETF flows | Positive | Weakening or turning negative |
| Futures open interest | Controlled | Expanding rapidly |
| Funding rates | Moderate | Extremely positive |
| Spot demand | Supports price | Begins weakening |
| Altcoin speculation | Selective | Broad speculative frenzy |
The most concerning setup would be Bitcoin continuing to rise while Fear & Greed enters extreme territory, futures open interest accelerates, funding becomes expensive and ETF flows weaken. In that situation, price would increasingly depend on leveraged traders chasing momentum rather than on new spot demand. By contrast, high sentiment accompanied by stable leverage and continuing ETF buying may simply reflect a strong trending market.
There are already some signs of overheating. Bitcoin’s 14-day Relative Strength Index moved above 70 during the rapid climb, a level commonly described as technically overbought. But an RSI above 70, like Fear & Greed at 74, measures the strength of recent momentum rather than predicting an immediate reversal. Strong trends can stay technically overbought longer than traders expect.
Does Fear & Greed at 74 Mean Bitcoin Will Crash?
No. A Fear & Greed reading of 74 does not mean Bitcoin is about to crash, just as a reading in Extreme Fear does not guarantee an immediate rally.
High sentiment can produce two very different outcomes. In one scenario, aggressive buying exhausts available demand. Early investors take profits, momentum slows and a correction begins. This is the classic contrarian interpretation of extreme greed. In another scenario, strong underlying demand allows prices to keep rising even while the index remains elevated for days or weeks.
The more useful question is therefore not whether Fear & Greed has reached a particular number, but what is happening underneath the score. If sentiment reaches Extreme Greed while ETF demand remains strong and leverage stays controlled, the market could continue trending higher. If extreme sentiment arrives alongside weakening spot flows and rapidly growing leveraged longs, correction risk would become much more significant.
Could the 2025 $19 Billion Liquidation Repeat?
The latest sentiment reading has drawn attention partly because of what happened the last time the index was near similar levels. CoinDesk noted that the gauge had not been this high since around October 5, 2025. Five days later, the crypto market suffered a historic deleveraging event in which more than $19 billion of leveraged positions were liquidated in roughly 24 hours.
That comparison is useful as a warning but dangerous as a prediction. A Fear & Greed reading did not cause the 2025 collapse. The severity of that event came from a combination of macro shocks, crowded leverage, thin liquidity and cascading liquidations. Perpetual futures open interest contracted dramatically during the event as leveraged positions were forced out.
Current conditions are not identical. Bitcoin-denominated futures open interest is falling rather than expanding rapidly, and funding rates remain relatively contained. The lesson from 2025 is therefore not that “74 means another crash.” It is that highly optimistic markets become vulnerable when leverage and liquidity conditions deteriorate at the same time.
Why Bitcoin Could Still Pull Back From $80K
Even if the rally is not dangerously overleveraged, Bitcoin can still experience a meaningful correction. The simplest reason is profit-taking. BTC climbed from the low-$60,000s toward $80,000 in roughly a week, giving traders who bought during the earlier sell-off a strong incentive to realize gains. Bitcoin subsequently slipped back below $79,000 after briefly trading above $80,000.
The $80,000–$83,000 region has also become an important market reference. Bitcoin encountered selling near $81,000, while analysts are monitoring the previous May high around $82,820 as a potential confirmation level if buyers regain control. These should not be interpreted as guaranteed resistance or breakout targets; they simply show where recent trading activity has concentrated.
Macro conditions present another source of uncertainty. The rally benefited from easing pressure on long-term Treasury yields, but rate expectations can reverse quickly. Traders are now closely watching Federal Reserve Chair Kevin Warsh’s Jackson Hole speech for clues about inflation and interest rates. Renewed expectations for tighter policy have already put some pressure on the recent risk-asset rally.
What Would a Healthy Bitcoin Pullback Look Like?
A Bitcoin decline is not automatically bearish. In fact, after such a rapid advance, a period of consolidation could improve market structure if it removes speculative excess without destroying underlying demand.
A healthier pullback would involve Bitcoin giving back part of its recent gains while futures leverage continues to decline, funding rates remain moderate and spot ETF flows stay positive. In that scenario, the market would essentially be allowing short-term traders to take profits while longer-term or institutional buyers continue absorbing supply. Altcoin and memecoin speculation could also cool, reducing the degree of FOMO across the wider market.
A more concerning correction would combine falling Bitcoin prices with persistent ETF outflows, accelerating spot selling and large long liquidations. That would suggest weakness is no longer just profit-taking but is spreading into the demand base that helped support the original rally.
What Could Push Bitcoin Higher From Here?
The strongest case for another leg higher would begin with continued spot demand. ETF inflows have already helped replace the temporary buying created by the short squeeze. If that flow persists while Bitcoin holds relatively close to its recent highs, it would suggest investors are still willing to deploy fresh capital despite elevated sentiment.
Macro conditions will remain equally important. Bitcoin benefited when pressure on long-duration Treasury yields eased and the dollar weakened. A stable or supportive rates environment would make it easier for investors to maintain exposure to risk assets, while sharply higher yields could create competition from government bonds and weigh on speculative markets.
Finally, controlled leverage would actually strengthen the bullish case. The healthiest setup would not necessarily be a sudden explosion in futures open interest. Instead, Bitcoin could stabilize or rise while ETF and spot demand remain firm, funding stays manageable and leverage rebuilds only gradually. That would indicate the market is being driven more by capital allocation than by traders borrowing aggressively to chase price.
Is the Bitcoin Rally Really Getting Overheated?
There is evidence that parts of the crypto market are overheating. The Fear & Greed Index jumped from 27 to 74 in less than two weeks, Bitcoin rallied more than 20% in a matter of days, smaller speculative tokens surged, and traders began paying millions of dollars for short-dated call options betting on further upside. One trade involved 2,000 Bitcoin call contracts with an $82,000 strike, costing buyers about $2.9 million in premium.
Yet the options market itself also reveals caution. Short-term skew turned negative during the rally, indicating investors were still willing to pay for downside protection even while others bought bullish calls. In other words, traders do not want to miss further upside, but they are also aware that Bitcoin has moved extremely quickly.
That leaves the market in an unusual position: sentiment looks hot, but leverage does not yet look euphoric. ETF inflows and spot demand provide a stronger foundation than the Fear & Greed score alone would suggest. The rally is therefore showing early signs of overheating, but it has not yet developed all the characteristics typically associated with a fragile leverage-driven top.
Conclusion
Bitcoin’s move above $80,000 has rapidly transformed crypto sentiment. The Fear & Greed Index reaching 74 shows how quickly investors have moved from caution to confidence, while rising altcoins, memecoin speculation and bullish options trades confirm that FOMO is returning.
However, greed should not be confused with an automatic sell signal. Bitcoin futures open interest has fallen, funding rates remain relatively moderate and spot ETF inflows continue to provide genuine demand. That makes the current market structurally different from a rally driven entirely by leveraged speculation.
The next phase will depend less on whether Fear & Greed moves from 74 to 75 and more on what happens beneath the headline number. ETF flows, spot demand, futures open interest, funding rates, Treasury yields and Bitcoin’s ability to hold recent gains will provide a clearer answer to the real question: is this simply a strong bull-market recovery, or is optimism beginning to turn into unsustainable speculation?
FAQs
Who created the Crypto Fear & Greed Index?
The widely followed crypto version is published by Alternative.me. The company combines several Bitcoin-related market and sentiment indicators into a daily score between zero and 100. Alternative.me requires attribution when its Fear & Greed data is displayed or reused commercially.
How often is the Crypto Fear & Greed Index updated?
Alternative.me updates the index daily. Because the score incorporates changing market momentum, volatility, social activity, dominance and search behavior, readings can move significantly from one day to the next during volatile periods.
Is the Crypto Fear & Greed Index only for Bitcoin?
Alternative.me states that its current index is primarily for Bitcoin, even though it is frequently described as a broader “crypto” sentiment gauge. Bitcoin volatility and momentum form a large part of the calculation, so the score should not be interpreted as a direct sentiment reading for every individual altcoin.
What is the highest possible Crypto Fear & Greed score?
The maximum score is 100, representing Extreme Greed. A reading close to 100 indicates unusually strong bullish sentiment and risk appetite, but it does not guarantee that the market has reached its final top.
Is the Fear & Greed Index useful for long-term investors?
It can provide useful context about whether market participants are unusually fearful or optimistic, but it should generally be combined with other information such as valuation, liquidity, ETF flows, on-chain data and macroeconomic conditions. A sentiment score by itself does not measure Bitcoin’s long-term fundamental value.
Why can Bitcoin keep rising when Fear & Greed is already high?
Momentum can persist for extended periods in strong trending markets. If new spot buyers continue entering while supply remains limited, Bitcoin can rise even when sentiment indicators show widespread optimism. High greed mainly signals that expectations are elevated; it does not impose a ceiling on price.
What is the difference between Bitcoin dominance and the Fear & Greed Index?
Bitcoin dominance measures Bitcoin’s share of the total cryptocurrency market capitalization. The Fear & Greed Index measures sentiment using multiple inputs, one of which is Bitcoin dominance. A falling dominance rate can sometimes indicate that investors are taking more risk in altcoins, while the broader Fear & Greed score attempts to capture the overall emotional state of the Bitcoin market.
🔥 KuCoin Offers A More Stable Option in A Volatile Market
If you worry about the frequent ups and downs in the market, and pursue a more stable option to earn money passively, KuCoin is the right place to come:
Simple Earn: Deposit and withdraw tokens anytime, earning stable returns.
Kucoin Earn: Earn stable profits with professional asset management.
Hold to Earn: Earn rewards by holding assets in Funding, Trading, Margin, Futures, Mining, and Unified Accounts.
Staking: Unlock the earning potential of on-chain assets.
Advanced Investments: Advanced Investments offer a variety of structured products to help your money grow in any market.
Shark Fin: Principal Protection and Guaranteed Gains
Dual Investment: Buy low and sell high with transparent return calculations.
Snowball: High yields, with price protection.
Discount Buy: Buy crypto at discount prices.
KCS Loyalty: Level up to enjoy exclusive perks by staking ≥ 1 KCS.
KuCoin Wealth: Discover future value and begin your smart investing journey.
KCS Benefits: Hold and stake KCS to access benefits across the platform.
KCS Staking 2.0: Participate in KCS on-chain governance to earn yield.
Disclaimer: This content is for informational purposes only and does not constitute investment advice. Cryptocurrency investments carry risk. Please do your own research (DYOR).