

U.S. Budget Deficit Hits $2 Trillion in 2026: Causes, National Debt, and Market Impact
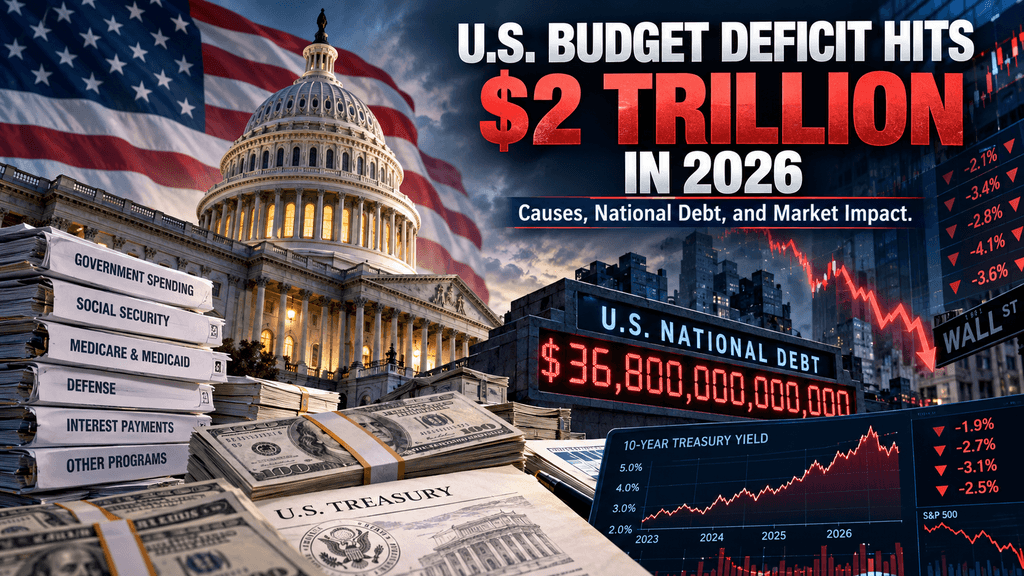
U.S. Fiscal Deficit Expands as Rising Interest Payments Deepen Long-Term Debt Concerns
The Congressional Budget Office has recently reported that the federal budget deficit for the fiscal year 2026, which concluded on September 30, amounted to an estimated range of approximately $1.993 trillion to $2.0 trillion. This substantial figure represents a notable increase of $218 billion, or 12 percent, when compared to the $1.775 trillion shortfall that was recorded in the previous fiscal year of 2025. Federal spending during this period reached an impressive total of nearly $7.4 trillion, reflecting a rise of 6 percent, while federal receipts grew at a more modest pace of 3 percent, surpassing $5.4 trillion. Net interest payments on the public debt surged by 11 percent, equating to about $115 billion, bringing the total to approximately $1.1 trillion to $1.143 trillion. This increase has positioned net interest payments as the second-largest category in the federal budget, following Social Security. The widening budget gap has occurred even as the broader economy has remained relatively stable, characterized by low unemployment rates.
This situation shows the underlying structural pressures stemming from an aging population, previous legislative changes, and elevated borrowing costs that continue to challenge fiscal stability. The gross national debt exceeded $40 trillion earlier in the year, while the debt held by the public was reported to be in the vicinity of $32.3 trillion to $32.4 trillion, which is approximately equivalent to 100 percent of the nation’s Gross Domestic Product (GDP). These financial outcomes position the deficit for 2026 among the largest in the history of the United States, outside of periods of wartime or severe economic recession, trailing only the significant shortfalls experienced during the pandemic years of 2020 and 2021. This persistent high level of deficit, occurring in the absence of a major national emergency, serves as a clear signal of growing fiscal strain. Such strain has the potential to elevate long-term interest costs, crowd out other critical priorities, and significantly influence Treasury yields as well as investor confidence in the U.S. debt markets.
Interest Payments on the National Debt Climb Past $1 Trillion for the First Time
Net interest outlays on the public debt reached more than $1.1 trillion in fiscal 2026, an 11 percent increase of approximately $115 billion from the prior year. This rise stemmed directly from the larger stock of outstanding debt and higher long-term interest rates compared with fiscal 2025. Interest costs now exceed defense spending, and Medicare outlays in magnitude represent about 15 percent of total federal spending, up sharply from roughly 8.5 percent a decade earlier. The average rate on marketable Treasuries has climbed notably in recent years as lower-yielding securities mature and must be refinanced at current market levels. CBO data confirm that the increase in interest alone accounted for a substantial share of the overall deficit expansion. Policymakers face a feedback loop in which higher debt generates higher servicing costs, which in turn require additional borrowing.
Recent analyses indicate that sustained rates even 150 basis points above earlier baseline assumptions could add trillions to cumulative deficits over the coming decade and push debt-to-GDP ratios well above 120 percent. Market participants have already responded with elevated yields on both intermediate and long-term Treasuries, reflecting heightened sensitivity to the fiscal journey. The composition of the debt portfolio matters because a significant portion continues to roll over into higher-rate instruments. Short-term rate movements provided only partial offsets, leaving the net interest burden on an upward path. This dynamic reduces fiscal flexibility for other programs and raises questions about the sustainability of current spending and revenue policies under prevailing economic conditions. Official estimates place interest costs at a record 3.4 percent of GDP, more than triple the levels seen between 2018 and 2021. The absence of offsetting revenue gains large enough to cover these outlays has left the deficit structurally wider than earlier projections anticipated.
Social Security Outlays Rise with More Beneficiaries and Higher Average Benefits
Spending on Social Security benefits increased by $86 billion, or 5 percent, in fiscal 2026. The growth reflected both a larger number of beneficiaries and higher average benefit amounts, consistent with demographic trends of an aging population and annual cost-of-living adjustments. CBO noted that the increase would have been larger without certain one-time retroactive payments related to prior legislation. Social Security remains the single largest federal expenditure category, and its direction is largely determined by existing benefit formulas and demographic realities rather than annual discretionary decisions. The program’s trust fund faces projected insolvency within the coming decade under current law, which would trigger automatic across-the-board reductions unless Congress acts. Higher beneficiary counts stem from the ongoing retirement of the baby-boom generation and longer life expectancies.
Average benefits have also risen with wage growth and inflation adjustments embedded in the program’s design. These factors produced a steady upward pressure on outlays that outpaced overall revenue growth of 3 percent. The structural nature of Social Security spending limits near-term options for deficit reduction without legislative changes to eligibility ages, benefit formulas, or revenue sources. Analysts at nonpartisan organizations have repeatedly shown the need for bipartisan reforms to restore long-term solvency and avoid abrupt cuts. The 2026 experience illustrates how demographic momentum continues to widen the gap between dedicated payroll tax collections and benefit obligations. Without adjustments, the program will claim an increasing share of total federal resources, further constraining other budget priorities and contributing to persistent primary deficits.
Medicare Spending Expands on Enrollment Growth and Higher Payment Rates
Medicare outlays rose by $77 billion, or 8 percent, during fiscal 2026. The increase resulted from expanded enrollment among eligible older Americans and higher payment rates to providers and plans. Combined with Social Security and Medicaid, the three major mandatory health and retirement programs drove the majority of non-interest spending growth. Medicare’s cost trajectory is influenced by medical inflation, utilization patterns, and the steady influx of new beneficiaries. Payment rate adjustments and enrollment gains produced an 8 percent rise that exceeded the overall revenue increase. CBO data show that these mandatory programs together accounted for a large fraction of the $386 billion total spending increase relative to fiscal 2025.
The program’s structure, with its mix of fee-for-service and managed-care components, transmits higher healthcare prices directly into federal outlays. Longer-term projections indicate that Medicare will continue to grow faster than GDP under current law, adding to cumulative deficits. Efforts to control costs through payment reforms or competitive bidding have produced only modest offsets to date. The 2026 figures underscore that demographic and price pressures remain dominant drivers. Higher enrollment follows the same aging trend visible in Social Security, while payment rates reflect broader healthcare cost trends. These dynamics leave Medicare as a central contributor to the structural deficit and limit the effectiveness of short-term discretionary restraint.
Medicaid Costs Climb with Rising Per-Enrollee Expenses
Medicaid spending increased by $55 billion, or 8 percent, in fiscal 2026, driven primarily by higher costs per enrollee rather than large enrollment swings. The program covers low-income individuals, families, and certain disabled populations, with spending shared between federal and state governments. Rising healthcare prices, pharmaceutical costs, and utilization intensity pushed per-enrollee expenditures higher. CBO attributed the 8 percent growth to these cost pressures. When combined with Medicare and Social Security, the three programs generated a $217 billion increase that constituted the bulk of non-interest outlay growth.
Medicaid’s open-ended entitlement design means federal costs respond automatically to state decisions and medical inflation. Latest legislative changes affecting eligibility or matching rates have not yet fully offset the underlying cost growth visible in 2026. The program remains sensitive to economic conditions that influence enrollment, yet even in a relatively stable labor market, the per-enrollee cost trend continued upward. This pattern reinforces the contribution of mandatory health spending to the overall deficit and highlights the challenge of achieving durable fiscal balance without addressing the drivers of healthcare cost inflation.
Revenue Growth Lags as Corporate Tax Collections Decline
Federal receipts rose 3 percent, or roughly $169 billion, to more than $5.4 trillion in fiscal 2026. Individual income and payroll taxes provided the main gains, increasing by about $255 billion, or 6 percent. Corporate income tax collections, however, fell by $70 billion, or 16 percent, largely because of more generous investment write-offs enacted in the prior year’s reconciliation legislation. Customs duties remained relatively flat after the government issued approximately $130 billion in tariff refunds following a Supreme Court ruling that certain global tariffs violated federal law. The net result was revenue growth that failed to keep pace with the 6 percent rise in spending.
The composition of the revenue increase reveals limited progress toward closing the structural gap. Stronger individual tax receipts reflected wage and employment growth, yet corporate and tariff categories underperformed relative to earlier expectations. The tariff refunds alone removed a meaningful amount of anticipated revenue. These outcomes left the deficit higher than CBO’s earlier baseline projections for the year and demonstrated that recent tax policy changes and legal developments reduced the government’s capacity to offset rising mandatory and interest costs through higher collections.
National Debt Surpasses Key Milestones and Approaches Full GDP Ratio
Gross federal debt reached a record $40 trillion during 2026, while debt held by the public ended the fiscal year near $32.3 trillion to $32.4 trillion, approximately equal to 100 percent of GDP. The $2.3 trillion increase in publicly held debt from the prior year reflects the cumulative impact of successive large deficits. Debt-to-GDP ratios at these levels have historically been associated with elevated risk premia and reduced fiscal space for responding to future shocks. Interest costs already absorb a growing share of the budget, and further increases in the debt stock will amplify that burden under current rate conditions.
Nonpartisan fiscal monitors have described the direction as unsustainable without policy changes that meaningfully reduce primary deficits. The pace of debt accumulation has outstripped nominal GDP growth in recent years, producing the current ratio. Market yields on longer-term Treasuries have risen in response, with the 10-year note and 30-year bond reaching multi-year highs in early October 2026. Investors appear to be pricing in greater fiscal risk, which feeds back into higher government borrowing costs and further deficit pressure. The combination of high debt levels and rising rates creates a self-reinforcing cycle that complicates efforts to stabilize the fiscal position.
Defense Spending Increases Moderately Amid Broader Fiscal Pressures
Defense outlays rose by $48 billion, or 5 percent, in fiscal 2026. While this growth was more modest than the increases recorded for major entitlement programs and interest, it still contributed to the overall spending rise of $386 billion. Defense remains a significant discretionary category, yet its share of the budget continues to be constrained by mandatory spending and debt service. The 5 percent increase reflects ongoing operational requirements, personnel costs, and procurement needs.
In an environment of $2 trillion deficits, even moderate growth in defense competes with other priorities for limited fiscal resources. The relative restraint in defense growth compared with entitlements and interest highlights the shift in budget composition toward mandatory and debt-related outlays. Policymakers must balance national security requirements against the broader fiscal picture. Continued large deficits reduce the margin available for future defense adjustments without further elevating debt or requiring offsetting cuts elsewhere.
Tariff Refunds and Legal Rulings Reduce Expected Customs Revenue
Approximately $130 billion in tariff refunds was issued during fiscal 2026 after the Supreme Court determined that certain global tariffs imposed by the administration violated federal law. This development kept customs duty collections relatively flat despite higher statutory rates in some categories. The refunds directly widened the deficit by removing revenue that earlier projections had anticipated. CBO data show that tariff-related receipts failed to deliver the substantial gains sometimes claimed in public statements.
The legal outcome illustrates how judicial review can alter expected fiscal flows mid-year and complicate budget planning. The episode also underscores the difficulty of relying on trade measures as a durable revenue source when legal challenges succeed. Combined with the decline in corporate tax collections, the tariff refunds left overall receipts growing at only half the pace of spending. Future trade policy will need to account for potential legal and administrative constraints if it is to contribute meaningfully to deficit reduction.
Market Yields Rise as Investors Price in Fiscal Risk
Treasury yields climbed notably in 2026, with the 10-year note reaching levels around 5.366 percent and the 30-year bond near 5.732 percent at points in early October, the highest for each since 2002. These movements reflect investor concerns about the sustainability of large deficits, the growing debt stock, and the prospect of continued high interest costs. Rising yields increase the government’s future refinancing costs and reinforce the upward pressure on net interest outlays. Bond market participants have cited the combination of elevated deficits, corporate debt issuance, and Federal Reserve policy expectations as contributing factors.
The fiscal journey has become a more prominent variable in rate determination. Higher yields also affect private borrowing costs, potentially slowing investment and economic activity over time. The feedback from fiscal conditions into financial markets creates an additional constraint on policy. Officials and analysts have noted that the full impact of recent yield increases has not yet been fully reflected in the interest expense figures for 2026, implying further upward pressure in subsequent years if rates remain elevated.
Entitlement and Interest Drivers Dominate the Deficit Expansion
The $218 billion widening of the deficit between fiscal 2025 and 2026 resulted primarily from a $386 billion increase in spending that exceeded the $169 billion gain in revenue. Of the spending rise, higher mandatory outlays for Social Security, Medicare, and Medicaid, together with the $115 billion jump in interest costs, accounted for the majority. Defense contributed a smaller share. This composition shows that the deficit problem is concentrated in programs and debt service whose growth is largely automatic under current law.
Primary deficits remain elevated even in a period of economic expansion and low unemployment, confirming the structural character of the imbalance. Nonpartisan observers have described running near-$2 trillion deficits under these macroeconomic conditions as an unsustainable trend. The absence of major emergency spending in 2026 makes the outcome particularly notable. Without changes that slow the growth of mandatory programs or raise additional revenue, interest costs will continue to compound and claim an ever-larger share of the budget.
Long-Term Debt Projections Point to Further Deterioration
CBO and independent analyses project that debt held by the public will continue rising as a share of GDP over the next decade under current policies, potentially reaching 120 percent or higher by the mid-2030s. Higher interest rates than assumed in earlier baselines could add several trillion dollars to cumulative deficits. Trust funds for Social Security and other programs face insolvency risks within the next decade, which would force automatic reductions unless addressed.
The 2026 outcome already exceeds earlier projections for the year, indicating that recent developments on rates, refunds, and corporate collections have worsened the near-term path. Stabilizing the debt ratio would require sustained primary surplus or substantially smaller deficits relative to GDP. Achieving that outcome would involve difficult trade-offs across entitlement formulas, tax policy, and discretionary priorities. The current trajectory leaves limited room for error in the event of future recessions or other shocks that typically expand deficits further.
Policy Responses Remain Limited Despite Clear Fiscal Signals
Neither major political party has advanced comprehensive measures sufficient to reverse the deficit trend in the near term. Proposals for commissions, PAYGO rules, or targeted reforms have been discussed by fiscal advocacy groups, yet legislative action has focused more on tax and spending packages that add to long-term debt. The 2026 experience, with its combination of higher interest, entitlement growth, and revenue shortfalls relative to spending, provides concrete evidence of the costs of delayed adjustment.
Market reactions in the form of higher yields already impose an implicit discipline that may intensify if deficits remain elevated. Credible paths forward would need to address the primary drivers identified in the CBO data: the growth of major mandatory programs and the interest burden generated by accumulated debt. Incremental changes that fail to alter these trajectories are unlikely to produce lasting improvement. The fiscal year just completed offers a clear benchmark against which future policy choices can be measured.
FAQs
What exactly was the size of the U.S. federal budget deficit in fiscal year 2026?
The Congressional Budget Office estimated the deficit at $1.993 trillion to $2.0 trillion for the fiscal year that ended September 30, 2026. This represented a $218 billion increase from the $1.775 trillion deficit in fiscal 2025. Spending totaled nearly $7.4 trillion while receipts reached more than $5.4 trillion. The figure ranks among the largest annual deficits on record outside of the COVID-19 emergency years.
Why did interest costs rise so sharply in 2026?
Net interest payments increased by about $115 billion, or 11 percent, to roughly $1.1 trillion to $1.143 trillion. The rise reflected both a larger outstanding debt stock and higher long-term interest rates compared with the prior year. Interest became the second-largest budget category after Social Security and now absorbs a significantly larger share of total outlays than a decade ago.
How much did Social Security, Medicare, and Medicaid contribute to higher spending?
Social Security outlays rose $86 billion (5 percent), Medicare $77 billion (8 percent), and Medicaid $55 billion (8 percent). Together, these three programs accounted for the bulk of the non-interest spending increase. Growth was driven by more beneficiaries, higher average benefits or payment rates, and rising costs per enrollee.
Did revenue grow in fiscal 2026?
Yes, total receipts increased 3 percent, or about $169 billion, to more than $5.4 trillion. Individual income and payroll taxes provided most of the gain. Corporate income tax collections declined 16 percent because of expanded investment write-offs, and tariff-related receipts were reduced by approximately $130 billion in court-ordered refunds.
What is the current level of the national debt?
Gross federal debt surpassed $40 trillion during 2026. Debt held by the public stood near $32.3 trillion to $32.4 trillion at the end of the fiscal year, roughly 100 percent of GDP. The publicly held debt increased by about $2.3 trillion from the previous year.
Disclaimer: This content is for informational purposes only and does not constitute investment advice. Investments carry risk. Please do your own research (DYOR).