

Why Bitcoin Volatility Is Historically Low in 2026: Glassnode Points to Long-Term Holders
Introduction
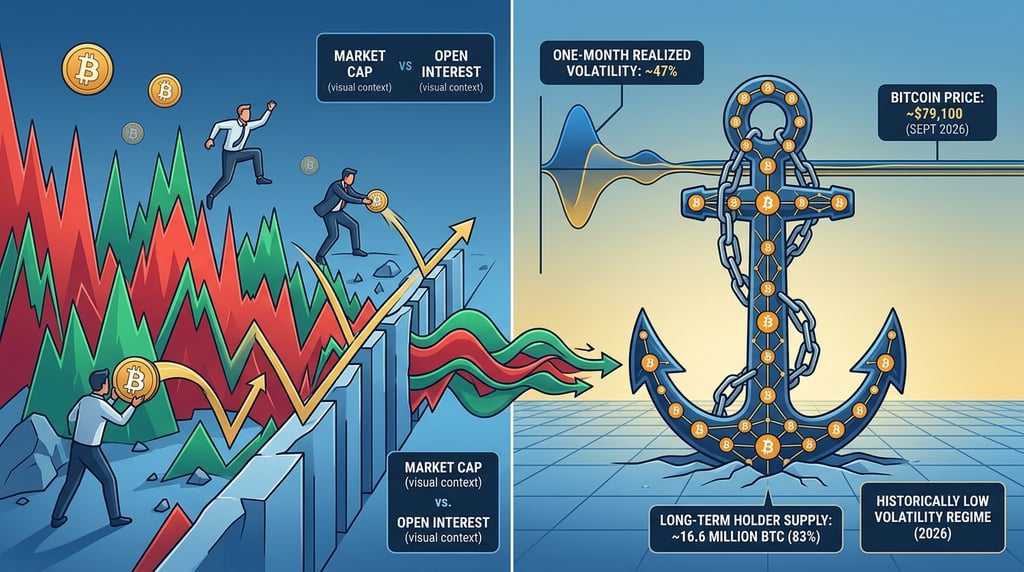
Bitcoin is often described as a high-volatility asset, yet that reputation is not matching the tape in September 2026. According to Glassnode, one-month realized volatility sits at historically low levels, and the strongest statistical driver is not market cap, futures open interest, or trading turnover. It is long-term holder supply — coins that have not moved for at least 155 days. That ownership structure is absorbing available float, reducing the amount of Bitcoin that can be pushed around by short-term flows, and helping explain why price can trade near $79,100 while swings stay compressed.
Why Is Bitcoin Volatility Historically Low in 2026?
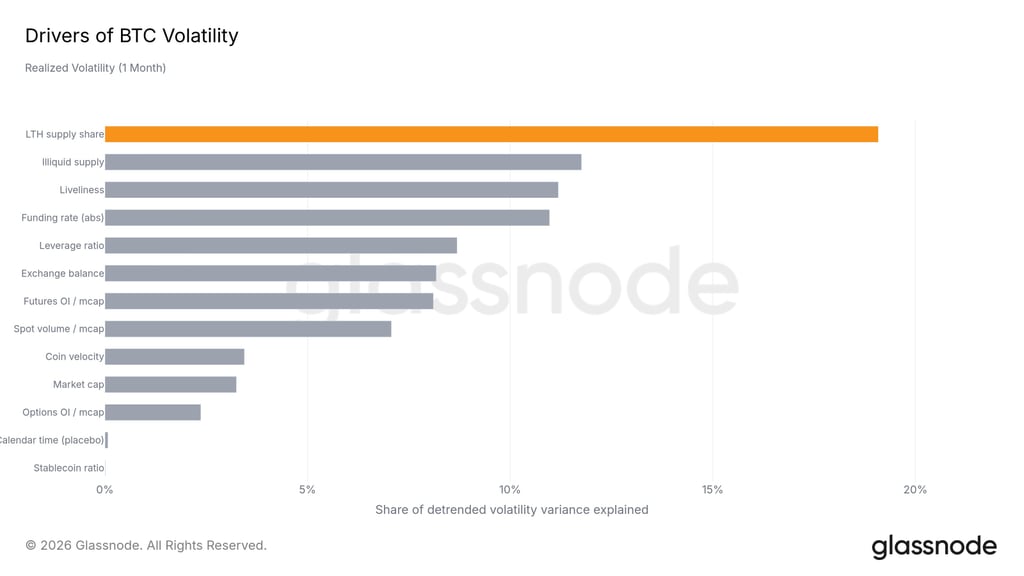
Bitcoin volatility is historically low in 2026 because a large share of circulating supply is locked with patient holders rather than circulating through exchanges and derivatives books. Glassnode stated on September 8, 2026 that “BTC volatility is currently historically low,” and that “the strongest driver of low vol is not market cap. It is who holds the coins.” Long-term holder supply explained more of realized volatility than market capitalization, open interest, or turnover.
Glassnode compared 13 variables against detrended one-month realized volatility. Detrending strips out the long-run trend so shorter-term relationships can be measured. Long-term holder supply led the ranking at nearly 19% of explained variance. Illiquid supply followed at about 12%. Liveliness — a measure of older-coin spending — ranked third at about 11%. Market capitalization accounted for only about 3%.
That ranking matters because many traders still treat Bitcoin’s size as the main reason swings have cooled. Larger market cap can absorb more dollar flow, but Glassnode’s result says ownership composition is doing more work than scale. When coins sit idle, the liquid float shrinks. The same buy or sell order then travels less far through the order book.
Glassnode Studio data as of September 7, 2026 put one-month annualized realized volatility at 47.25%, with the one-week reading at 37.55%, the three-month reading at 37.59%, and the one-year reading at 43.51%. Those levels are well below Bitcoin’s long-run realized-volatility average near 80%, according to VanEck’s mid-August 2026 ChainCheck, which also recorded 30-day realized volatility at 27.2% on August 11, 2026.
How Do Long-Term Holders Suppress Bitcoin Price Swings?
Long-term holders suppress swings by keeping coins off the market for 155 days or more, so fewer coins are available to meet new demand or absorb forced selling. Glassnode generally classifies long-term holder supply as coins held for at least 155 days. That cohort set another all-time high on July 21, 2026 after reaching approximately 16.64 million BTC, or about 83% of circulating supply, in June 2026.
When that share is elevated, daily trading has a thinner float to work against. Spot volume can stay moderate even when headlines look busy. Glassnode’s BTC Market Pulse for Week 37, published September 8, 2026, put weekly spot volume at $5.3 billion while Bitcoin held near $79,100 inside a $77,300 to $81,300 range.
Illiquid supply ranked second in Glassnode’s volatility study for the same reason. Illiquid coins sit in wallets with little history of spending. Liveliness ranked third because it rises when old coins move and falls when they stay parked. High long-term holder supply plus low liveliness is a market that is not recycling coins quickly.
VanEck’s August 18, 2026 report used a stricter one-year holding cutoff and showed a different snapshot: coins held longer than a year fell 356,000 BTC over 30 days to 11.84 million BTC, or 59.1% of circulating supply as of August 11, 2026. The two definitions are not identical, but both point to the same mechanism. When older cohorts stop spending, realized volatility compresses.
What Do Realized and Implied Volatility Show Right Now?
Realized volatility remains subdued relative to Bitcoin’s history, while options markets are pricing even less movement than the recent tape has delivered. Glassnode Studio listed Deribit at-the-money implied volatility as of September 8, 2026 at 39.38% for one week, 38.08% for one month, 39.74% for three months, and 40.31% for six months.
Glassnode’s Week 37 Market Pulse said the volatility spread had widened to -20.9%, meaning implied volatility was trading under realized volatility. The 25-delta skew fell from 0.79% to -2.05%. Both readings sat below their lower statistical bands. That combination describes a market where options are not charging a large premium for future swings, even as call demand relative to puts increased.
VanEck’s mid-August 2026 print of 27.2% annualized 30-day realized volatility sat at roughly one-third of the firm’s cited long-run average near 80%. The September Glassnode Studio one-month reading of 47.25% is higher than that August trough, but it is still far from the 60%–100% bands that defined earlier Bitcoin cycles.
Low realized volatility does not mean price cannot jump. It means the recent distribution of daily returns has been tight. A single large session can lift short-window realized volatility quickly because squared returns dominate the calculation. The broader message from Glassnode is that the baseline remains compressed while long-term holders control the float.
Why Don’t Market Cap, Open Interest, and Turnover Explain the Calm?
Market cap, open interest, and turnover explain less of the current calm because they measure size and activity, not how much supply is actually available to trade. Glassnode put market cap near the bottom of its 13-variable ranking at about 3% of detrended volatility variance. Open interest and turnover also lagged long-term holder supply, illiquid supply, and liveliness.
Size can still matter. A larger network can absorb larger dollar flows without the same percentage move. But two markets with the same capitalization can behave differently if one has 80% of supply dormant and the other has a large liquid float on exchanges. Glassnode’s conclusion is that “who holds the coins” is the binding constraint in 2026.
Derivatives positioning is building even as volatility stays low. According to Glassnode’s Week 37 Market Pulse, futures open interest rose 1.0% to $37.1 billion and sat above its upper statistical band. Options open interest rose 2.1% to $40.1 billion, also above its upper band. Long-side funding payments fell 32.8% to $1.3 million, so leverage grew without an equally aggressive bid for upside.
That mix can look contradictory. Open interest is high, yet realized swings are contained. The Glassnode ranking helps resolve the contradiction. Leverage can exist on top of a tight spot float. If long-term holders do not sell, futures and options can expand without immediately producing the large spot moves traders associate with crowded positioning.
How Tight Is Bitcoin’s Liquid Supply in September 2026?
Bitcoin’s liquid supply remains tight because most coins are either aged into the long-term cohort or sitting in wallets that rarely spend. Glassnode’s June 2026 snapshot of about 16.64 million BTC in long-term holder supply, roughly 83% of circulating coins, is the clearest recent official marker of that tightness.
On-chain activity in the latest Glassnode pulse is quiet relative to price. Entity-adjusted transfer volume fell 12.8% to $5.0 billion. Fee volume fell 4.8% to $213,000. Active addresses were flat at 635,600. Those readings sat inside their statistical bands while price held near $79,100.
Profitability is high enough that many holders have little forced reason to sell. Glassnode’s Week 37 report put 69.3% of coins in profit, with NUPL far above its upper band and the realized profit-to-loss ratio back at parity at 1.0. Monthly realized cap change accelerated to 0.8%, and hot capital share climbed to 30.1%, both above their upper bands.
ETF demand is adding another bid against that tight float. US spot Bitcoin ETFs took in $681.2 million of net inflows in the Week 37 window, up from $247.8 million the prior week, according to Glassnode. ETF MVRV swung from -0.54 to 1.31, leaving ETF holders in aggregate profit. Creations pull coins into wrappers that often behave like long-duration holdings even if they are not classified as 155-day long-term holder supply on-chain.
What Could Break the Low-Volatility Regime?
The low-volatility regime can break if long-term holders start spending, if liveliness rises, or if a shock hits a thin float while leverage is elevated. Glassnode’s own ranking implies the first risk is the most important. If the cohort that explained nearly 19% of volatility variance begins to distribute, realized volatility has a direct channel to reprice higher.
Overhead supply is one place that distribution could appear. Glassnode’s Week On-chain research in late August 2026 flagged a heavy long-term holder cluster between $83,000 and $86,000. A push into that band would test whether those holders sell near breakeven. That test does not require a crash. It only requires older coins to move.
Leverage is the amplifier, not the base case in Glassnode’s study. Futures open interest at $37.1 billion and options open interest at $40.1 billion, both above their upper bands in Week 37, mean forced de-risking can still produce outsized sessions. Funding has cooled, which reduces one source of squeeze risk, but open interest remains large relative to recent spot volume of $5.3 billion.
Implied volatility sitting below realized volatility is another watch item. A negative volatility spread of -20.9% in Glassnode’s Week 37 pulse means options were cheaper than the moves the market had already delivered. If realized volatility rises from the September 7 Glassnode Studio one-month reading of 47.25%, options pricing may have to catch up, which can feed hedging flows.
None of those risks cancel the current fact set. As of early September 2026, Glassnode still describes volatility as historically low and still ranks long-term holder supply first.
How Should Traders Read Low Bitcoin Volatility?
Traders should read low Bitcoin volatility as a supply story first and a leverage story second. Glassnode’s September 8, 2026 analysis is explicit: long-term holder supply explains more of realized volatility than market cap, open interest, or turnover. Position sizing and breakout planning should start with that float, not with the assumption that “Bitcoin is always volatile.”
Range-bound price action can persist while capital still enters. Glassnode’s Week 37 snapshot showed a flat week near $79,100, cooling spot momentum, and rising ETF inflows at the same time. That is a market digesting gains against a tight holder base, not a market that has gone quiet because nobody is participating.
Low volatility also changes option and futures design. Shorter-dated implied volatility near 38%–39% on Deribit, according to Glassnode Studio as of September 8, 2026, prices smaller daily ranges than Bitcoin’s multi-year average. Strategies that assume 80% realized volatility will overstate expected range unless holder behavior changes.
The useful checklist is simple. Watch long-term holder supply and liveliness for the base regime. Watch illiquid supply for confirmation. Watch open interest and funding for amplification. Watch the $83,000–$86,000 long-term holder cost-basis wall identified in Glassnode’s late-August research for the first major distribution test.
Beyond the Headlines: What KuCoin 5.0 Means for You
Market news moves fast — but where you act on it matters just as much. This October, KuCoin launches KuCoin 5.0, transforming KuCoin into a rebuilt platform. Here's what actually changes for you:
-
One account for everything. Older platforms split your money across separate "spot," "margin," and "futures" accounts and expected you to understand why. KuCoin 5.0's unified account removes that entirely — deposit once, and everything is simply there.
-
Stocks, indices, and commodities. KuCoin 5.0 expands beyond crypto into global markets. When crypto chops sideways and equities rally (or the reverse), you rotate in minutes instead of opening a brokerage account and waiting days for fiat rails.
-
Real-world assets (RWA). Tokenized exposure to traditional assets like commodities, right inside your crypto account. One of the fastest-growing segments in global finance is no longer reserved for institutions — you access it from the same balance you trade with.
-
Earn while you learn. Not ready to trade? KCUSD lets your stablecoins earn daily, auto-compounding interest. The lowest-stress way to put your idle deposit to work for 4% yield.
-
An AI assistant in plain language. Ask questions, get market context, understand what you're looking at — built into the platform, no jargon required.
-
An app that doesn't overwhelm. Faster, cleaner, and consistent — intuitive from the first tap, not after a tutorial.
-
Safety you can check, not just trust. A MiCAR-licensed EU entity, Proof of Reserves you can verify yourself, and internationally certified security (SOC 2 Type II, ISO 27001:2022).
Create your account in minutes — and start on the platform built for where crypto is going, not where it's been.
Conclusion
Bitcoin volatility is historically low in 2026 because long-term holders, not market cap, are the dominant supply constraint. Glassnode’s September 8, 2026 analysis found that long-term holder supply explained nearly 19% of detrended one-month realized-volatility variance, ahead of illiquid supply at about 12% and liveliness at about 11%. Market cap explained only about 3%.
Official Glassnode Studio readings as of September 7–8, 2026 show one-month realized volatility at 47.25% and one-month Deribit at-the-money implied volatility at 38.08%. VanEck’s August 18, 2026 ChainCheck recorded a 27.2% 30-day realized-volatility print against a long-run average near 80%. Glassnode’s Week 37 Market Pulse placed spot near $79,100, futures open interest at $37.1 billion, options open interest at $40.1 billion, and 69.3% of supply in profit, with US spot ETF net inflows of $681.2 million.
The practical takeaway is straightforward. Ownership structure is damping realized swings. Leverage can still amplify a break. The first variable to watch is whether long-term holders keep holding.
FAQs
Is Bitcoin’s 2026 volatility the lowest on record?
Glassnode describes current one-month realized volatility as historically low as of September 8, 2026, and VanEck’s mid-August 2026 30-day reading of 27.2% sat far below the firm’s cited long-run average near 80%.
What holding period defines a Bitcoin long-term holder?
Glassnode generally treats coins held for at least 155 days as long-term holder supply. VanEck’s August 2026 ChainCheck used a separate one-year cutoff when it reported 11.84 million BTC held longer than a year.
Does low volatility mean Bitcoin cannot rally or sell off quickly?
No. A thin float can still produce sharp sessions if long-term holders spend or if leveraged positions unwind. Glassnode still ranks holder supply first, but futures open interest at $37.1 billion remains an amplifier.
How is implied volatility different from realized volatility here?
Realized volatility measures past price swings. Implied volatility is the options market’s forward estimate. Glassnode Studio put one-month realized volatility at 47.25% as of September 7, 2026, while Deribit one-month at-the-money implied volatility was 38.08% as of September 8, 2026.
Why do ETF inflows matter if holders already control most supply?
ETF creations add another longer-duration bid against a tight float. Glassnode’s Week 37 pulse recorded $681.2 million of US spot Bitcoin ETF net inflows and an ETF MVRV shift into profit at 1.31.
Disclaimer: This article is for informational purposes only and does not constitute financial, legal, or investment advice. Always conduct your own research before interacting with digital assets.