

Bitcoin Price Correction in 2026: Is BTC Near a Bottom?

Bitcoin's latest pullback has raised a familiar question among traders: is the correction nearing its end, or could BTC fall further before recovering? Trader Killa, a quantitative trader, believes the decline may be approaching its limit, pointing to historical market cycles in which Bitcoin experienced smaller retracements during bull markets than during bear markets.
Based on this comparison, he estimates that a 10% to 15% pullback could fit the current cycle. However, historical patterns alone cannot confirm a market bottom. To assess whether the correction is losing momentum, it is worth examining what is driving Bitcoin's recent decline and whether current market conditions support the case for a recovery.
Why Is Bitcoin Falling in October 2026?
Bitcoin's recent decline reflects more than a change in market sentiment. After struggling to hold its October highs, BTC has come under pressure from ETF outflows, weakness in technology stocks, and uncertainty ahead of the Federal Reserve's latest policy decision.
Understanding how these factors have affected Bitcoin's price helps explain whether the correction is easing or could continue.
Bitcoin Price Correction: From October Highs to $80,000
Bitcoin reached an intraday high of approximately $87,150 on October 2 before falling to around $79,300 on October 26. That represents a decline of about 9% from the October high, bringing BTC close to the 10% pullback discussed by trader Killa.
BTC also struggled to sustain its recovery toward $84,000. After reaching an intraday high near $84,860 on October 21, it fell below $80,000 over the weekend and briefly traded near $79,330 on October 26.
This short-term correction should be distinguished from Bitcoin's larger decline from its all-time high of approximately $126,080. At around $80,000, BTC was roughly 36% below that peak, showing that the current pullback forms part of a broader decline rather than an isolated 10% move.
Fed Uncertainty and Bitcoin ETF Outflows Add Selling Pressure
Investors have also become more cautious ahead of the Federal Reserve's October 27–28 meeting, with concerns about interest rates and a sell-off in technology stocks weighing on riskier assets. When investors reduce exposure to these markets, Bitcoin can come under pressure alongside equities.
Spot Bitcoin ETF flows offer another clue. US spot Bitcoin ETFs recorded $526.7 million in net inflows on October 19 and $524.8 million on October 21, before seeing $635.6 million in outflows on October 22 and a further $137.9 million on October 23.
Leveraged trading has added to the pressure. When Bitcoin falls, exchanges can automatically close leveraged positions that no longer meet margin requirements, creating additional selling. On October 24, approximately $404 million in long positions were liquidated across the crypto market within four hours as Bitcoin briefly fell below $80,000, according to The Block, citing CoinGlass data.
Together, these developments help explain Bitcoin's weakness, but they do not establish whether the correction has reached its limit. That depends in part on how much room BTC typically has to fall during a bull-market pullback.
Is a 10% Bitcoin Correction Normal in a Bull Market?
A falling Bitcoin price does not necessarily mean the broader market trend has ended. BTC has experienced substantial declines during previous bull markets before recovering, but the size of a pullback alone cannot tell traders whether another rally will follow.
Trader Killa's latest analysis uses this historical pattern to argue that the current correction may be nearing its limit, although the comparison has important limitations.
What Bitcoin's Previous Market Cycles Reveal About Pullbacks
A bear market is a prolonged period of declining prices, while a pullback is a shorter decline that can occur even when prices are generally rising. Bitcoin's history shows that these movements can vary significantly in size.
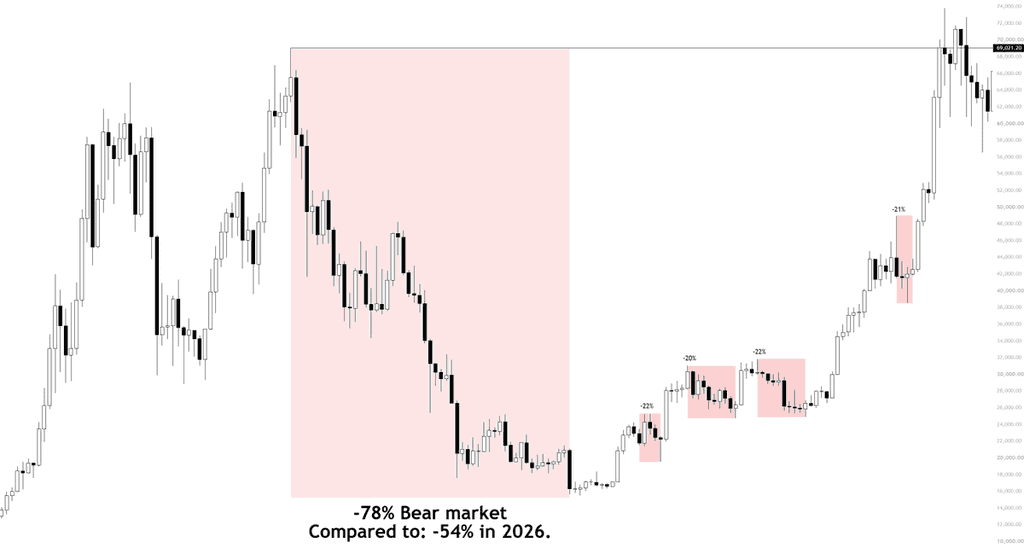
During the 2021–2022 bear market, BTC fell approximately 77% from its peak of around $69,000 to roughly $15,800. In the following recovery, Bitcoin experienced several corrections before reaching a new all-time high near $126,000 in October 2025.
The distinction matters because a bull-market correction does not have to be small to occur within a broader recovery. The depth of past declines provides context, but it does not establish a fixed percentage that Bitcoin must follow in future cycles.
Killa's Bitcoin Correction Theory: Why 10%–15% Matters
In his October 25 analysis, Killa compared the previous bear market's 77%–78% decline with a subsequent bull-market pullback of around 20%–22%. He argues that the current cycle's smaller, roughly 54% bear-market decline could point to a shallower correction of about 10%–15%. With BTC already down around 10% from its recent high, he believes the pullback may be nearing its end.
Source: Killa’s X
However, this is a comparison proposed by one trader, not a proven relationship between market cycles. Historical drawdowns also vary depending on the prices, dates, and measurement methods used. A 10% decline therefore cannot confirm that selling has run its course, and BTC could fall further if demand weakens or broader market conditions deteriorate.
What Signals Could Confirm Bitcoin's Price Correction Is Ending?
A price decline slowing down does not necessarily mean Bitcoin has reached a bottom. Traders can look for three signs of a possible recovery: BTC holding support, renewed demand from investors, and less pressure from leveraged trading. None guarantees a rebound, but together they can help show whether market conditions are improving.
Bitcoin Price Support: Can BTC Reclaim $82,500?
Bitcoin's ability to hold key price levels is one of the clearest ways to assess whether selling pressure is easing. On October 26, BTC was trading around $80,000 after falling below the 80,500 to 81,000 area. The next support zone was around 78,500 to 79,000, while 82,200 to 82,500 and $84,000 were potential resistance areas to watch.
If BTC holds support and begins making higher lows, it could suggest that buyers are becoming more willing to enter the market. A stronger sign of recovery would be a move back above resistance that holds through subsequent daily closes, ideally with increased trading volume. If Bitcoin instead falls below support and struggles to reclaim it, the correction may have further to run.
These levels are reference points based on recent price action, not guaranteed turning points.
Spot Bitcoin ETF Flows: Are Investors Returning?
Spot Bitcoin ETF flows offer another way to assess investor demand. After a period of strong inflows, these funds recorded net outflows later in October, suggesting that demand had become less consistent.
A sustained return to net inflows, alongside a stabilizing BTC price, would provide stronger evidence of renewed investor interest than a single positive trading session. However, ETF flows represent only one part of the market and cannot confirm a Bitcoin price bottom on their own.
Bitcoin Liquidations: Is Selling Pressure Easing?
Leveraged trading can make Bitcoin's price movements more severe. When prices fall far enough, exchanges may automatically close traders' positions, adding to selling pressure.
On October 24, approximately $404 million in leveraged long positions across the crypto market were liquidated within four hours as Bitcoin briefly fell below $80,000. Total liquidations reached about $815 million over 24 hours, according to CoinGlass data cited by The Block.
A decline in forced liquidations could mean that some immediate selling pressure has passed, but it would not confirm a bottom. The stronger signal would be a combination of fewer liquidations, sustained ETF inflows, and Bitcoin holding or reclaiming important price levels.
For now, these indicators provide a framework for assessing a possible recovery, not proof that the correction is over.
Bitcoin Price Prediction 2026: Bullish and Bearish Scenarios
Bitcoin's next move depends on whether buyers can regain control or if selling pressure continues. A recovery remains possible if BTC stabilizes and investor demand improves, but a sustained break below support could lead to further losses. Two scenarios help explain what traders should watch without assuming either outcome is certain.
Bullish Scenario: Can Bitcoin Recover Above $84,000?
Bitcoin's recovery case would strengthen if it holds a support area, begins forming higher lows, and moves back above recent resistance. The 82,000 to 84,000 range is worth watching because BTC struggled to sustain a move through this area during October's rebound.
Renewed spot Bitcoin ETF inflows and stronger buying in the spot market would add support to this scenario. Broader financial conditions could also help: if the Federal Reserve signals a less restrictive approach to interest rates, risk-sensitive assets such as Bitcoin may benefit. However, even a move above resistance would need to hold before it could be treated as stronger evidence of recovery.
Bearish Scenario: Could Bitcoin Fall Further?
The outlook would weaken if BTC fails to hold support, ETF outflows persist, and selling increases. Bitcoin's recent move below $80,000 shows why traders should not assume that this level will hold.
Coinbase Institutional has identified the 72,000 to 74,500 area as a possible next region to watch if the 80,000 to 82,000 support zone fails. This is a conditional market scenario, not a guaranteed price target.
Persistent inflation or a more restrictive outlook from the Federal Reserve could also weigh on demand. If leveraged traders continue to face forced closures during price declines, additional selling could deepen the correction.
What Should BTC Traders Watch Next?
The Federal Reserve's October 27–28 meeting is a key near-term event. Traders can also watch Bitcoin's daily closes around support and resistance, spot ETF flows, trading volume, and leveraged liquidations.
A combination of sustained price recovery and improving demand would strengthen the bullish case. If support breaks and selling continues, the risk of a deeper correction increases. Neither scenario can be confirmed by a single price move or indicator.
Does Bitcoin's Historical Pullback Pattern Still Hold in 2026?
Historical patterns can help explain Bitcoin's price movements, but they do not guarantee that the next correction will follow the same path. The current cycle has different market conditions, including greater access to Bitcoin through spot ETFs and changing economic pressures.
These differences matter when deciding how much weight to give Killa's 10%–15% pullback estimate.
Why Bitcoin's 2026 Market Cycle May Be Different
Bitcoin's market has changed since previous cycles. Spot ETFs give investors another way to gain exposure to BTC without holding it directly, while institutional participation adds another source of demand. However, ETF activity can also reverse, as the October outflows show.
Broader economic conditions matter, too. Interest-rate expectations, investor confidence, and available market liquidity can influence whether buyers step in during a decline or continue selling. Leverage can further increase price swings when traders are forced to close positions.
These factors do not make Bitcoin less volatile by default. They mean that previous cycles may offer useful comparisons, but they cannot fully explain how the current market will behave.
When Could a Bitcoin Pullback Become a Deeper Correction?
The key question is whether BTC can regain an upward trend or continue to lose ground. If the price holds support, buying demand returns, and BTC reclaims resistance, the decline may prove to be a temporary correction. If support breaks while ETF outflows and selling pressure persist, the risk of further losses increases.
Historical comparisons also need context. Binance Research noted in October that Bitcoin's current bear-market decline was smaller in percentage terms than previous cycles, but looked similar in severity when adjusted for the market's lower volatility. This challenges the idea that a smaller percentage decline necessarily means less risk.
Killa's 10%–15% estimate is therefore one possible scenario, not a reliable price floor. The current market's direction will depend on whether demand improves and selling pressure eases, not simply on how closely BTC follows previous cycles.
Conclusion
Bitcoin's correction may be approaching a short-term turning point, but a 10% decline alone does not establish a bottom. Killa's historical comparison offers one possible explanation for where the pullback could end, while ETF flows, price support, and selling pressure provide more immediate clues.
For now, BTC needs to hold support and reclaim resistance with sustained buying demand to strengthen the recovery case. Until those conditions emerge, the risk of a deeper decline remains.
FAQs
Is Bitcoin's price correction almost over in 2026?
Bitcoin's correction may be nearing its end, but confirmation requires stronger price support, renewed buying demand, and improving market conditions. Further declines remain possible.
How much does Bitcoin usually drop during a bull-market correction?
Bitcoin's bull-market corrections vary in size. Previous cycles offer useful comparisons, but there is no fixed percentage that reliably identifies the end of a pullback.
Can Bitcoin fall further after a 10% correction?
Yes. Bitcoin can fall further if selling pressure persists, ETF outflows continue, or key support levels break. A 10% decline does not guarantee a rebound.
What signals indicate that Bitcoin has reached a price bottom?
Potential signs include BTC holding support, forming higher lows, reclaiming resistance, sustained spot ETF inflows, and easing selling pressure. No single indicator confirms a bottom.
How do Bitcoin ETF outflows affect BTC's price?
ETF outflows indicate that investors are withdrawing more money from these funds than they are adding. Sustained outflows may signal weaker demand and add pressure to BTC's price.
Disclaimer
This general market information, possibly from third-party, commercial, or sponsored sources, is provided for reference and educational purposes only and does not constitute financial or investment advice, an offer, solicitation, or guarantee. We disclaim liability for its accuracy, completeness, reliability, and any resulting losses. Investments/trading are risky; past performance doesn’t guarantee future results. Users should research, judge prudently, and take full responsibility. For further details, please consult KuCoin’s Terms of Use and Risk Disclosure.