
The Demand Destruction Reality: Inside the Major Banks' Bearish Turn on Silver After the $120 Bubble
2026/06/13 11:10:00
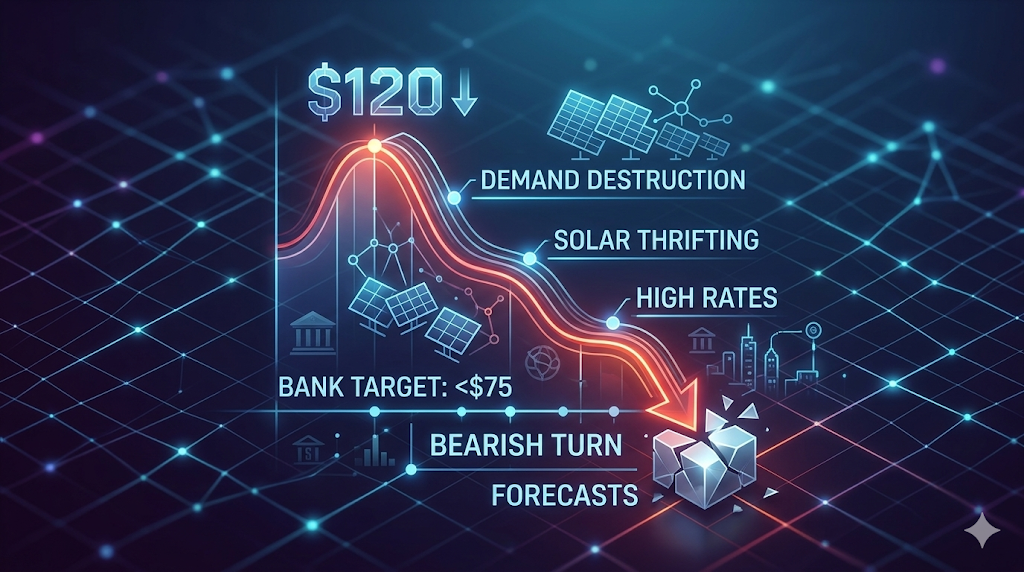
Did you know that silver's historic $120 peak in January 2026 sparked the fastest demand collapse in modern commodities history? The silver market is currently trapped below $75, and major banks are explicitly warning investors to prepare for a prolonged bear market. Bank of America projects that the global silver deficit will shrink by an astonishing 90% this year due to massive industrial demand destruction.
As solar manufacturers and jewelers aggressively cut consumption, the foundation of the silver bull thesis is rapidly crumbling.
The Collapse of the $120 Silver Bubble
The January 2026 Euphoria and Reality Check
The silver market suffered a brutal correction after peaking at an all-time high of $121.64 in January 2026. This sudden collapse to below $75 per ounce exposed the fragility of momentum-driven speculation. Retail investors who purchased at the peak are now trapped holding a highly volatile asset.
According to market data from May 2026, the sharp decline occurred because speculative capital rapidly exited the market once industrial fundamentals failed to support the elevated pricing. The market aggressively realized that industrial consumers will simply not pay triple-digit premiums for raw materials.
Bank of America’s Stark Warning
Bank of America predicts the global silver deficit could decline by an astonishing 90% this year. Michael Widmer, Head of Metals Research, issued a stark warning in late May 2026 that silver’s fundamental demand is easing significantly. The bank cautions that even modest investor outflows could flip the entire market into a surplus.
This bearish outlook shatters the prevailing narrative that perpetual supply shortages will guarantee permanently higher silver prices throughout the decade.
The Illusion of Safe-Haven Flows
Safe-haven flows cannot sustain elevated silver prices indefinitely while core industrial consumption collapses. Silver is fundamentally an industrial commodity, meaning its valuation relies heavily on physical manufacturing demand. While geopolitical fears temporarily drove the gold-to-silver ratio to extreme levels in early 2026, this momentum faded entirely.
Investors relying exclusively on safe-haven narratives ignore the massive demand destruction currently occurring across the global electronics and automotive sectors. True monetary metals like gold can hold value entirely on institutional hoarding, but silver requires active, continuous corporate consumption to justify its market capitalization.
The Mechanics of Demand Destruction
Solar Thrifting Reduces Photovoltaic Demand
Photovoltaic manufacturers are actively managing silver consumption through a process known as solar thrifting. According to reports from PV Magazine and Metals Focus, industrial silver demand from the solar sector is projected to decrease by approximately 19% year-over-year. In response to the earlier price volatility near $120, panel manufacturers accelerated the adoption of lean-silver architectures and advanced cell designs, such as zero-busbar layouts. This technological shift indicates that while the green energy sector continues its rapid growth, its structural reliance on physical silver per megawatt is permanently lower than in previous years.
Jewelry and Silverware Consumption Softens
Elevated retail prices have significantly slowed consumption in the global jewelry and silverware fabrication sectors. Data from the Silver Institute indicates a 9% contraction in global jewelry demand and a 17% decline in silverware manufacturing. Price-sensitive retail consumers in critical markets like India have scaled back physical purchases at these high valuations. This elasticity demonstrates that everyday consumer demand remains responsive to extreme price adjustments, temporarily shifting retail market dynamics and lowering physical inventory velocity.
The Narrowing Supply Deficit
The multi-year streak of large structural silver supply deficits is narrowing significantly. Because industrial scaling and retail consumption are cooling simultaneously, the previous projections for acute physical shortages are being adjusted downward. Late May banking data shows that the global deficit is shrinking at a notable pace. While the market is still expected to remain in a structural deficit for the sixth consecutive year, the smaller margin alters the long-term investment thesis.
Financial institutions, including Bank of America, note that with a thinner deficit buffer, the market's price stability will depend heavily on whether investment flows remain steady or face outflows.
Industrial Dynamics and Market Constraints
The Structural Divergence Between Silver and Gold
Silver operates as a self-regulating asset because its price trends closely influence its rate of industrial consumption. Unlike gold, which is primarily held in central bank reserves and financial portfolios, over 50% of global silver demand comes from industrial manufacturers operating on tight commercial margins.
When silver prices experience sharp increases, manufacturing buyers regularly scale back or defer procurement. This industrial exposure implies that silver faces greater difficulty sustaining speculative price premiums without clear macroeconomic support from the physical supply chain.
Substitution Trends in Green Technology
The green energy sector continues to fund research into viable alternatives for silver in electrical components. Cost-effective substitutes, including copper-based formulations and specialized conductive polymers, are being tested for certain electronics applications.
While the early 2026 price volatility accelerated corporate investment into alternative materials, engineering challenges such as oxidation risk mean that widespread commercial scaling remains a gradual, long-term process. Nevertheless, a structural reduction in silver intensity per unit remains a key risk factor for long-term commodity modeling.
Operating Pressures on Mining Production
Declining ore grades and stricter regulatory frameworks have raised baseline expenses for global silver miners. Industry data from May 2026 indicates that environmental compliance costs have risen by 15% to 25% across key producing jurisdictions, lifting average all-in sustaining costs (AISC) above $28 per ounce for many marginal producers. Despite historically elevated spot prices, this margin inflation limits the net profitability of the extraction sector. Consequently, mining corporations frequently utilize forward-hedging strategies to lock in revenue, introducing steady selling pressure that caps short-term price breakouts.
Evaluating the Major Banks' 2026 Forecasts
| Financial Institution | 2026 Silver Price Forecast | Primary Market Thesis |
| Bank of America | $75 by Q2 2027 | Structural demand destruction and surplus risks |
| JPMorgan | $81 average for 2026 | Stabilization after speculative momentum fades |
| Commerzbank | $90 ceiling by year-end | Subdued industrial consumption limits upside |
Bank of America’s Price Reversion Model
Bank of America’s quantitative models forecast silver reverting to an average of $75 per ounce by the second quarter of 2027. While their analysts note that a broader precious metals rally could temporarily push silver toward $100 in late 2026, they expect this level to be unsustainable due to underlying supply-demand dynamics. This reversion model suggests caution regarding long-term physical positions at elevated premiums, framing silver as a tactical trading instrument rather than a core long-term portfolio holding in the current economic environment.
JPMorgan and Commerzbank Perspectives
According to institutional notes from May 2026, JPMorgan and Commerzbank maintain measured price targets for the remainder of the year. JPMorgan projects an annual average of approximately $81 per ounce, while Commerzbank forecasts a $90 ceiling by year-end.
These estimates reflect a broader institutional consensus that acknowledges the impact of demand destruction and a stabilizing physical supply chain, tempering the more aggressive trippled-digit targets found in retail markets.
The Market Volatility Factor
Market liquidity dynamics suggest that silver will maintain a high volatility profile throughout 2026. Because the physical and financial market for silver is significantly smaller than that of gold, automated trading programs and sudden shifts in investor sentiment can generate sharp price movements.
The approximately 31% correction from the January peak underscores the asset's susceptibility to rapid shifts in liquidity, highlighting the importance of risk management and structured entry points for market participants.
The Macroeconomic Headwinds for Precious Metals
Shifting Monetary Policy Expectations
Hotter-than-expected inflation metrics in the first half of 2026 have substantially adjusted market consensus regarding immediate central bank interest rate cuts. According to macroeconomic data from May 2026, persistent inflationary pressures are prompting the Federal Reserve to signal that borrowing costs will remain elevated for an extended duration. Financial firms, including Goldman Sachs, have revised their outlooks to project no interest rate reductions within the calendar year.
This restrictive monetary framework introduces steady headwinds for non-yielding precious metals, as guaranteed corporate and government treasury yields incentivize institutional capital to reallocate away from speculative commodity positions.
The Strengthening US Dollar and Real Yields
A persistently resilient US dollar and elevated real interest rates continue to challenge globally priced commodities. Because industrial silver is denominated in greenbacks, currency strength increases procurement costs for international fabrication buyers.
Furthermore, competitive real yields diminish the relative appeal of holding speculative long positions in the precious metals complex. Analysts note that this dual macroeconomic configuration presents a structural barrier to price appreciation, meaning silver prices will likely face resistance near early-year resistance zones unless a broader monetary policy pivot occurs.
Evolution of the Geopolitical Risk Premium
While structural demand destruction across industrial sectors has emerged as the primary catalyst for silver's price correction from its $120 high, fluctuations in geopolitical risk premiums continue to introduce market volatility. Early 2026 price movements were highly responsive to supply chain and maritime transit disruptions across critical trade chokepoints, such as the Strait of Hormuz.
By late May 2026, initial diplomatic overtures regarding conditional transit access offered temporary psychological relief to the broader markets. However, lingering regional frictions indicate that while the acute panic-buying premium has moderated, underlying geopolitical uncertainty remains an active variable alongside weakening physical manufacturing indicators.
Tactical Strategies in an Adjusted Commodity Market
High-Beta Allocation During Gold Breakouts
Market participants frequently utilize silver as a high-beta proxy for gold during structural precious metals rallies. Due to silver's smaller market capitalization and lower structural liquidity, it regularly exhibits amplified percentage movements relative to gold during upward momentum phases.
Institutional desks, however, tend to view these moves as near-term trading windows rather than long-term entry points. Capturing value in this environment relies on dynamic profit-taking protocols before underlying manufacturing constraints reintroduce headwinds for the physical asset.
Evaluating the Long-Term Holding Model
The shifting supply-demand balance sheet in 2026 introduces specific underperformance risks for passive, long-term physical positions. During periods characterized by industrial thrifting and narrowing structural deficits, a passive buy-and-hold approach in physical bullion can be lower-yielding than actively managed strategies due to ongoing storage premiums and underlying material substitution.
Modern commodity portfolios increasingly favor highly liquid instruments, such as exchange-traded funds (ETFs) or dynamic options structures, over physical hoarding to mitigate carry costs and maintain capital flexibility during extended corrections.
Utilizing the Gold-to-Silver Ratio as a Strategic Anchor
The gold-to-silver ratio remains a core quantitative benchmark for timing cyclical entry and exit phases within the precious metals complex. The rapid compression of the ratio toward the mid-50s during the early-year price spike served as a technical indicator of speculative exhaustion in the silver market.
As market liquidity normalized through May 2026, the ratio reverted toward its mid-range near 60. Institutional asset managers continue to reference these structural boundaries to manage asset allocation risk and execute relative-value rebalancing with statistical consistency.
Utilizing Digital Platforms for Tactical Silver Positioning
Digital asset platforms introduce flexible methods for navigating the volatile, range-bound 2026 commodities market. While traditional physical bullion procurement often requires overcoming logistical frictions, localized dealer premiums, and ongoing custody expenses, digital alternatives streamline capital deployment.
For global market participants, utilizing modern trading venues allows for continuous portfolio adjustments without the capital drag associated with physical metal transport or private depository fees.
Navigating the 2026 Range via Strategic Contract Infrastructure
To capture short-term price momentum within the $70 to $85 corridor, traders frequently employ digital derivative infrastructure rather than physical holding strategies. On global exchanges such as KuCoin, participants manage silver price exposure through Precious Metals Futures Contracts, including the liquid XAG/USDT perpetual contract market.
While the venue does not currently host direct Spot Tokenized Silver Bullion Trading, its 24/7 futures marketplace grants immediate liquidity, allowing allocators to rotate capital into stablecoins the moment underlying structural demand signals deteriorate.
Implementing Systematic Risk Automation
Advanced trading venues provide specific algorithmic toolsets that complement tactical commodity positioning during periods of high structural asset volatility. Traders can deploy automated spot or futures grid programming to capture incremental returns within established support and resistance parameters.
Furthermore, utilizing institutional-grade conditional stop-loss triggers allows market participants to limit maximum financial drawdowns, ensuring portfolio capital remains structurally insulated if industrial demand destruction across the green-tech and industrial fabrication sectors continues to accelerate.
Conclusion
The market adjustment following the brief early-2026 peak near $120 has demonstrated the pronounced price elasticity underlying industrial commodity markets. Analytical desks across major institutions, including Bank of America, have demonstrated that localized demand thrifting is currently neutralizing a significant portion of the multi-year physical supply deficit. Accelerated tech-sector engineering layouts, a 19% contraction in solar-fabrication intensity, and softer consumer jewelry demand suggest that the physical supply chain introduces structural resistance against sustained triple-digit pricing in the near term.
While tactical price action driven by broader gold momentum may generate intermittent upward spikes, silver's underlying economic framework remains constrained by its manufacturing dependencies. The asset effectively serves a self-regulating function, where elevated prices naturally suppress downstream commercial procurement.
Consequently, contemporary portfolio managers increasingly favor dynamic allocation and risk-managed tactical positions over passive, long-term physical hoarding. Utilizing digital commodity infrastructure—specifically through liquid perpetual contracts and advanced automated grid strategies—offers market participants an efficient conduit to capture short-term price movements and manage capital drawdowns, all while bypassing the structural costs and logistical frictions inherent to traditional physical bullion ownership.
FAQs
What caused the silver price to hit $120 in early 2026?
The January 2026 surge near $120 was driven by a temporary alignment of elevated geopolitical risk premiums, institutional short-covering, and heavy retail option momentum. Automated algorithmic trading systems amplified the upward price action, which corrected sharply once downstream industrial buyers reduced physical procurement at triple-digit valuations.
What exactly is demand destruction in the silver market?
Demand destruction refers to a structural reduction in consumption when a commodity's price rises to levels that compromise manufacturing profit margins. In the silver market, this occurs when electronics and solar manufacturers alter production techniques to permanently lower the volume of raw metal required per unit.
Why is Bank of America maintaining a cautious outlook on silver for 2026?
Bank of America’s quantitative models suggest that the global silver deficit could contract by up to 90% this year due to shifting consumer dynamics. Their metals research team notes that a projected 19% reduction in photovoltaic silver intensity significantly narrows the structural supply shortage, making sustained triple-digit pricing less viable without a major monetary policy shift.
How does the gold-to-silver ratio assist market participants?
The gold-to-silver ratio measures the relative pricing between the two metals, indicating how many ounces of silver are required to equal the value of one ounce of gold. Commodity strategists monitor this ratio against historical deviations to identify periods where silver is statistically overextended or undervalued relative to gold, utilizing it as a quantitative guide for capital reallocation.
What are the operational differences between digital silver instruments and physical bullion?
Utilizing digital commodity instruments mitigates transaction friction, dealer premiums, and storage carry costs inherent to physical bullion vaults. Digital trading venues provide market participants with immediate execution capabilities, allowing for continuous risk management and stop-loss deployment during rapid market corrections, which is logistically difficult with physical metal.
Disclaimer:This content is for informational purposes only and does not constitute investment advice. Cryptocurrency investments carry risk. Please do your own research (DYOR).