

Nvidia Hits $237.88 Record as Traders Watch SOXL and DRAM for an AI Breakout
Nvidia’s Record Rally Raises Broader Semiconductor Cycle Expectations
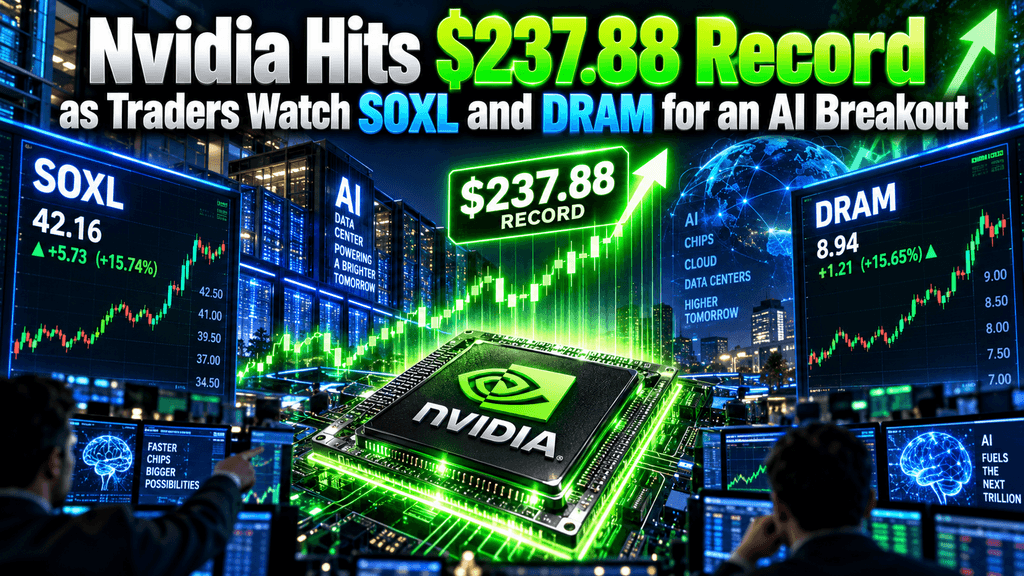
Nvidia shares climbed to an intraday peak of $237.88 on October 2, 2026, marking a fresh all-time high and pushing the company’s market capitalization toward $5.7 trillion. The move extended a rally that began in mid-September, driven by robust fiscal second-quarter results, an expanded $150 billion share-repurchase authorization, and continued institutional confidence in AI data-center spending. Closing prices subsequently advanced further, with the stock finishing at $238.90 on October 5 after touching $240.10 intraday.
Market participants have simultaneously focused on two specialized exchange-traded funds, the Direxion Daily Semiconductor Bull 3X Shares (SOXL) and the Roundhill Memory ETF (DRAM), as potential confirmation signals for broader participation in the artificial-intelligence hardware cycle. The recent record reflects both company-specific fundamentals and sector-level rotation into semiconductors after earlier-year skepticism about the durability of hyperscaler capital expenditure. Traders now evaluate whether the advance in Nvidia can catalyze follow-through in leveraged semiconductor exposure and memory-focused vehicles that capture high-bandwidth memory demand essential to GPU systems.
Record Intraday Peak and Subsequent Closes Confirm Technical Breakout
Nvidia’s October 2 session produced a high of $237.88 on volume exceeding 134 million shares, surpassing the prior May peak near $235–$236. The stock opened at $236.06, traded as low as $233.60, and settled at $233.95, still higher by 1.34 percent on the day. Subsequent sessions extended the advance: October 5 closed at a record $238.90 after an intraday top of $240.10, lifting market capitalization briefly above $5.76 trillion and placing the company within roughly 4 percent of a $6 trillion valuation, assuming approximately 24.15 billion shares outstanding.
Year-to-date performance through early October stood near 28 percent, contributing the largest single-stock increment to the S&P 500’s roughly 14 percent advance. Technical observers noted the break above a multi-month consolidation range and the swing area between $230 and $233, levels that now serve as potential support. Volume remained elevated relative to the prior month, although some sessions showed fading participation that analysts flagged as a watch point for sustainability. The advance coincided with the Nasdaq Composite and Nasdaq-100 also setting records, underscoring concentrated leadership from the largest AI-related name.
Institutional commentary reinforced the technical significance. Chart-focused analysts observed that the move brought price to the upper boundary of a six-month channel, raising the classic question of breakout versus temporary overshoot. Support references clustered near $230, with a sustained close above the prior highs viewed as constructive for targets in the $260 area cited by some technicians. Market-cap proximity to the $6 trillion threshold added psychological weight, as no public company had previously reached that level. The combination of fresh highs, elevated but not extreme volume, and index co-movement created a backdrop in which traders increasingly referenced secondary vehicles for confirmation of breadth.
Fiscal Second-Quarter Results Anchor the Fundamental Case
Nvidia reported fiscal second-quarter revenue of $96.2 billion for the period ended July 26, 2026, representing a 106 percent increase from the year-earlier quarter and an 18 percent sequential rise. Data-center revenue accounted for $89.0 billion, up 117 percent year over year and comprising more than 92 percent of total sales. Gross margins held at 75.0 percent on both GAAP and non-GAAP bases. Non-GAAP diluted earnings per share reached $2.22. Management guided third-quarter revenue to approximately $108 billion, plus or minus 2 percent, explicitly excluding any data-center compute contribution from China. Looking further ahead, the company indicated an expectation of roughly 70 percent revenue growth for fiscal 2028, a figure management described as constrained by supply rather than demand.
Hyperscale customers contributed $48.7 billion in the quarter, while the AI-cloud, industrial, and enterprise segment added $40.3 billion. These figures arrived after earlier periods of investor concern that capital-expenditure cycles might moderate; the actual results and guidance reset expectations higher. Free-cash-flow generation remained substantial, supporting both organic investment and shareholder returns. The earnings release provided concrete evidence that AI infrastructure spending continued at scale. Foxconn, a major server manufacturer for Nvidia systems, later reported third-quarter revenue growth of 47 percent, offering supply-chain corroboration.
Management commentary emphasized that tokens generated by deployed systems were producing measurable economic value, shifting the narrative from pure infrastructure build-out toward productive utilization. The combination of sequential growth, elevated margins, and multi-year visibility differentiated the report from earlier quarters that had already set high bars. Investors responded by lifting the stock through the remainder of September and into early October, converting the fundamental data into the price action that produced the $237.88 record.
On September 28, 2026, Nvidia’s board authorized an additional $150 billion under its existing share-repurchase program, bringing remaining capacity to $235 billion expected to be executed through fiscal 2028. Chief Executive Officer Jensen Huang characterized the increase as reflecting confidence in the long-term opportunity. The authorization ranked among the largest single expansions in corporate history and arrived at a moment when the stock’s forward multiple sat near multi-year lows relative to expected earnings growth.
At roughly 15–17 times projected fiscal 2028 earnings in some analyst frameworks, the valuation left room for both multiple expansion and earnings accretion from reduced share count. Buybacks of this magnitude can meaningfully support earnings-per-share growth even if absolute net income expands at a slower rate than revenue. The announcement followed closely after the strong quarterly results and preceded the October price records by only a few sessions, contributing to the positive sentiment that carried shares higher. Market reaction treated the repurchase capacity as both a valuation support and a signal of internal assessment of capital allocation priorities.
With free-cash-flow generation already elevated, the company retained flexibility to fund research, capacity reservations with foundries, and customer financing arrangements while still returning capital. Analysts noted that the remaining authorization provided a multi-year buffer against potential periods of softer demand or elevated volatility. The timing, immediately before a high-profile meeting involving Huang and other technology executives, amplified the message of strategic confidence. Subsequent price action through the $237.88 level demonstrated that investors incorporated the repurchase news into their near-term positioning.
Morgan Stanley Reinstatement as Top Semiconductor Pick Adds Institutional Weight
Morgan Stanley analyst Joseph Moore reinstated Nvidia as the firm’s top semiconductor pick in early October, maintaining an Overweight rating and a $300 price target. The target implied approximately 25–28 percent upside from levels prevailing around the $237–$238 range. Moore’s note followed meetings with Huang and Chief Financial Officer Colette Kress and highlighted a diversified customer base spanning traditional hyperscalers and frontier AI laboratories, rising revenue per gigawatt of deployed power, and expanding opportunities in CPUs, networking, and related systems. The firm pointed to planned deployments of additional Nvidia GPUs at major cloud providers and the potential for agentic AI workloads to broaden demand beyond pure training clusters. Valuation commentary emphasized that the stock traded at roughly 15 times fiscal 2028 earnings estimates in Morgan Stanley’s framework, a multiple that did not require expansion for the thesis to work if earnings estimates continued to rise.
Consensus among the broader analyst community remained uniformly constructive. Surveys of more than 30 covering analysts produced an average price target above $320, with all ratings in the Buy category in some compilations. The reinstatement of top-pick status carried particular resonance because it arrived after a period in which other semiconductor names had occasionally led on relative strength. Moore’s emphasis on the early stage of the current product cycle and the structural constraints of power, cooling, and construction reinforced the multi-year duration of the opportunity. Investors interpreted the research note as incremental institutional endorsement coinciding with the technical breakout, contributing to the sustained bid that produced successive record closes.
SOXL Performance Reflects Leveraged Semiconductor Sensitivity
The Direxion Daily Semiconductor Bull 3X Shares (SOXL) seeks to deliver three times the daily performance of the NYSE Semiconductor Index. In early October, the ETF traded near $164–$169, reflecting sharp gains from September levels near $100–$120. On October 2, SOXL advanced more than 6 percent on elevated volume, coinciding with Nvidia’s record session. Thirty-day returns exceeded 30 percent in some measurements, while year-to-date performance approached or surpassed 250–290 percent depending on the exact endpoint. Holdings exposure includes Nvidia at a meaningful but not dominant weight within the underlying index (historically in the mid-single digits), alongside Micron, AMD, Intel, Broadcom, and equipment names. Because the product resets daily, multi-day compounding can produce returns that diverge from three times the cumulative index move; volatility drag becomes material during choppy periods.
Traders monitoring SOXL for confirmation of AI-related momentum treat sustained strength above key moving averages and channel boundaries as constructive. Chart commentary around the Nvidia high noted potential upside targets near $210 if support in the $150 area held. The leveraged structure amplifies both upside participation and downside risk, making the ETF a high-beta proxy rather than a long-term core holding for most institutional portfolios. Its recent advance alongside Nvidia suggested that the semiconductor complex as a whole was attracting capital rather than solely the single largest constituent. Volume spikes on up days indicated active positioning rather than passive drift. For participants seeking amplified exposure to the AI hardware theme, SOXL provided a liquid vehicle whose price action offered a real-time gauge of sector breadth beyond the megacap leader.
DRAM ETF Captures Memory Cycle Critical to AI Systems
The Roundhill Memory ETF (DRAM) concentrates on companies deriving substantial revenue from memory products, including DRAM, high-bandwidth memory, and NAND. Major positions typically include Samsung Electronics, SK Hynix, and Micron Technology, which together dominate the global supply of the high-bandwidth memory stacks required by advanced GPUs. In early October, the ETF traded near $60–$62, consolidating after stronger summer performance that had seen peaks above $80 earlier in the year. Technical patterns described by market observers included an ascending triangle with resistance near $64; a decisive break was viewed as opening potential toward $80. Volume remained active, reflecting interest from both retail and institutional participants seeking pure-play memory exposure without the full semiconductor equipment or logic-chip complex.
High-bandwidth memory demand has been tightly linked to Nvidia’s product cycle because each advanced GPU package incorporates multiple HBM stacks. Supply constraints in this segment have supported pricing power for the leading memory producers and, by extension, the ETF that tracks them. DRAM’s relative performance therefore serves as a secondary confirmation channel: strength in the memory complex implies that the physical constraints and pricing dynamics supporting Nvidia’s margins remain intact. The fund’s concentrated nature produces higher volatility than broad semiconductor indexes, yet it offers cleaner exposure to the memory upcycle that many strategists regard as a multi-year phenomenon. Traders watching both SOXL and DRAM treat concurrent strength as evidence that the AI hardware narrative is broadening rather than remaining confined to a single name.
Analyst Commentary Frames SOXL and DRAM as Confirmation Tools
Market technicians and independent analysts, including commentary associated with Ali Martinez, explicitly linked Nvidia’s record to the technical setups in SOXL and DRAM. Observations noted that SOXL appeared to be attempting a channel breakout on shorter timeframes, with $150 cited as a support reference and $210 as a potential measured target. DRAM was described as forming an ascending triangle whose resolution above $64 could signal further upside. These patterns were presented not as independent catalysts but as secondary indicators of whether capital was rotating into the broader AI and semiconductor complex. When the largest constituent reaches new highs, sustained follow-through in leveraged and specialized vehicles reduces the probability that the advance is purely idiosyncratic.
The framing matters because concentrated leadership can sometimes mask underlying fragility. If SOXL and DRAM fail to confirm, the risk increases that Nvidia’s move represents late-cycle positioning rather than the start of a new leg. Conversely, simultaneous breakouts would suggest that memory pricing, equipment orders, and broader chip demand are aligning with the GPU narrative. Volume characteristics, moving-average alignment, and relative strength versus the broader market all enter the assessment. Practitioners therefore monitor the two ETFs as real-time sentiment and breadth gauges rather than as primary investment vehicles for most long-only portfolios. The approach integrates price action across the capital structure of the AI hardware ecosystem.
Supply Chain and Hyperscaler CapEx Provide External Validation
Independent data points from the supply chain reinforced the demand narrative. Foxconn reported record monthly and quarterly revenue figures in the period surrounding Nvidia’s advance, attributing strength largely to AI server demand. Hyperscaler capital-expenditure plans remained elevated, with aggregate spending by the largest cloud providers projected in the high hundreds of billions of dollars for 2026 and still higher for 2027 in various industry estimates. Nvidia’s own disclosures indicated that customer forecasts implied even faster growth than the 70 percent fiscal 2028 target the company publicly guided, the difference arising from supply constraints rather than order softness. Power availability, data-center construction timelines, and advanced packaging capacity continue to function as the binding constraints.
These external signals matter because they reduce reliance on Nvidia’s own guidance alone. When a major contract manufacturer posts sequential records and when cloud providers maintain or expand multi-year investment programs, the probability rises that the current cycle extends beyond a single product generation. Memory producers have similarly reported sold-out conditions for high-bandwidth memory, supporting the thesis embedded in the DRAM ETF. The alignment of company results, supply-chain commentary, and customer spending plans created a multi-layered fundamental backdrop that traders referenced when evaluating the durability of the $237.88 breakout and the secondary ETF setups.
Valuation Context Relative to Growth Trajectory
At prices near $238–$240, Nvidia traded at forward multiples that many analysts described as reasonable or even modest relative to expected growth. Frameworks placing the stock at approximately 15–17 times fiscal 2028 earnings contrasted with higher multiples assigned to smaller, faster-growing semiconductor names or to the broader market in certain periods. The combination of 70 percent expected revenue growth, high incremental margins on data-center products, and substantial free-cash-flow conversion supported the argument that the absolute valuation, while large in market-capitalization terms, remained grounded in earnings power. Share-count reduction from the expanded buyback program further enhances per-share metrics over time.
Comparative analysis showed the stock trading at a discount to its own historical peak multiples and, in some calculations, to the S&P 500 on a growth-adjusted basis. Skeptics continued to debate the sustainability of hyperscaler spending and the eventual competitive response from custom ASICs, yet the near-term evidence of order strength and guidance credibility kept the valuation conversation constructive. The $300 target from Morgan Stanley and higher consensus averages implied that the market had not fully priced the multi-year opportunity in the view of covering analysts. Investors weighing entry or addition around the record high therefore balanced the technical overbought signals against the fundamental growth and valuation support.
Risk Factors and Potential Pullback Scenarios
Despite the constructive setup, several risk factors remain active. Daily-reset leveraged products such as SOXL introduce path dependency and volatility drag that can erode value during sideways or choppy markets even if the underlying index finishes higher over longer periods. Memory pricing cycles have historically been volatile, and any sudden easing of HBM constraints could pressure DRAM-related names. Macro variables, including interest-rate trajectories, power-grid limitations, and geopolitical restrictions on technology exports, retain the capacity to interrupt capital-expenditure plans. Concentrated ownership and high options activity around Nvidia itself can amplify short-term swings. Technical analysts noted that a failure to hold above the $230–$233 zone would reopen the possibility of a deeper retracement within the prior range.
Position sizing and time horizon therefore become critical. Participants using SOXL for tactical exposure typically employ strict risk parameters given the product’s design. Longer-term holders of Nvidia or the memory complex focus on fundamental milestones, quarterly order trends, new product ramps such as Vera Rubin, and hyperscaler commentary, rather than daily price prints. The record high itself does not eliminate these considerations; it merely shifts the reference points from which risk is measured. Balanced analysis incorporates both the evidence of sustained demand and the structural vulnerabilities inherent in a high-growth, capital-intensive industry.
How Concentrated AI Leadership Could Shape the Broader Market
Nvidia’s market capitalization approaching $6 trillion and its outsized contribution to major index returns highlight the degree of concentration in equity markets. The stock’s weighting in the S&P 500 and Nasdaq-100 means its daily moves measurably influence benchmark performance. Strength in related vehicles such as SOXL and DRAM suggests that capital is beginning to diffuse across the semiconductor value chain, potentially reducing pure single-stock risk for the broader indexes over time. At the same time, many AI business models depend on continued access to advanced accelerators, creating second-order linkages between Nvidia’s execution and the valuations of software and services companies building on its platform.
For portfolio construction, the episode illustrates both the opportunity and the challenge of thematic concentration. Allocators seeking AI exposure must decide whether to express the view through the dominant hardware provider, through leveraged or specialized ETFs, or through a diversified basket that includes memory, equipment, and networking names. The October price action and the concurrent attention to SOXL and DRAM provide a real-time case study in how markets price leadership and breadth simultaneously. Continued monitoring of order trends, capacity additions, and secondary-market confirmation will determine whether the current advance evolves into a sustained multi-quarter cycle or encounters the digestion periods characteristic of prior technology waves.
Practical Ways for Monitoring the Theme
Market participants tracking the AI hardware complex now have a clear set of reference points: Nvidia’s ability to hold and extend above the $237–$240 zone, SOXL’s behavior relative to the $150 support and $210 target zone, and DRAM’s resolution of the $64 resistance area. Volume confirmation, relative strength versus the broader semiconductor index, and updates from major customers and suppliers will refine the probabilities attached to each scenario. Earnings calendars for memory producers and foundry partners offer additional data points in the coming weeks.
Options markets around Nvidia itself provide information on implied volatility and positioning that can signal near-term crowding or complacency. The integration of fundamental, technical, and inter-market analysis remains the most robust approach. Single indicators, whether a record high, a leveraged ETF breakout, or a memory-triangle resolution, rarely suffice in isolation. When several of these elements align, as they did in early October 2026, the evidence strengthens that the AI infrastructure cycle retains momentum. Traders and investors will continue to test that alignment in real time as new information arrives.
🔥 Beyond the Headlines: What KuCoin 5.0 Means for You
Market news moves fast — but where you act on it matters just as much. This October, KuCoin launches KuCoin 5.0, transforming KuCoin into a rebuilt platform. Here's what actually changes for you:
-
One account for everything. Older platforms split your money across separate "spot," "margin," and "futures" accounts and expected you to understand why. KuCoin 5.0's unified account removes that entirely — deposit once, and everything is simply there (only available to VIPs for now).
-
Stocks, indices, and commodities. KuCoin 5.0 expands beyond crypto into global markets. When crypto chops sideways and equities rally (or the reverse), you rotate in minutes instead of opening a brokerage account and waiting days for fiat rails.
-
Real-world assets (RWA). Tokenized exposure to traditional assets like commodities, right inside your crypto account. One of the fastest-growing segments in global finance is no longer reserved for institutions — you access it from the same balance you trade with.
-
Earn while you learn. Not ready to trade? KCUSD lets your stablecoins earn daily, auto-compounding interest. The lowest-stress way to put your idle deposit to work for 4% yield.
-
An AI assistant in plain language. Ask questions, get market context, understand what you're looking at — built into the platform, no jargon required.
-
An app that doesn't overwhelm. Faster, cleaner, and consistent — intuitive from the first tap, not after a tutorial.
-
Safety you can check, not just trust. A MiCAR-licensed EU entity, Proof of Reserves you can verify yourself, and internationally certified security (SOC 2 Type II, ISO 27001:2022).
Create your account in minutes — and start on the platform built for where crypto is going, not where it's been.
FAQs
How did Nvidia reach the $237.88 intraday high, and what followed?
Nvidia shares hit an intraday peak of $237.88 on October 2, 2026, during a session that also saw the stock close at $233.95 on elevated volume. The move capped a roughly 14 percent advance from mid-September levels near $209. Subsequent sessions extended the gains, with a closing record of $238.90 on October 5 after an intraday high of $240.10. Market capitalization briefly exceeded $5.76 trillion. The advance was supported by strong fiscal second-quarter results, an expanded share-repurchase authorization, and constructive analyst commentary.
What role do SOXL and DRAM play in the current AI narrative?
SOXL provides three-times daily leveraged exposure to a semiconductor index that includes Nvidia and other major chip companies, making it a high-beta gauge of sector momentum. DRAM offers concentrated exposure to memory producers whose high-bandwidth memory products are critical inputs for advanced GPUs. Traders and chart analysts have referenced both ETFs as secondary confirmation tools: strength in SOXL suggests broader semiconductor participation, while strength in DRAM indicates that the memory supply-demand balance supporting GPU margins remains favorable.
What were the key figures from Nvidia’s latest earnings report?
For the fiscal second quarter ended July 26, 2026, Nvidia reported revenue of $96.2 billion, up 106 percent year over year. Data center revenue reached $89.0 billion, up 117 percent. Gross margins stood at 75 percent. Non-GAAP earnings per share were $2.22. Guidance for the third quarter called for approximately $108 billion in revenue, plus or minus 2 percent, excluding China data center compute.
How large is Nvidia’s current share-repurchase authorization?
On September 28, 2026, Nvidia’s board authorized an additional $150 billion of share repurchases, bringing the remaining capacity to $235 billion expected to be executed through fiscal 2028. The expansion ranked among the largest single authorizations in corporate history and was described by management as reflecting confidence in the long-term opportunity.
What is Morgan Stanley’s current stance on Nvidia?
Morgan Stanley reinstated Nvidia as its top semiconductor pick in early October 2026, maintaining an Overweight rating and a $300 price target. Analyst Joseph Moore cited a diversified customer base, rising revenue per gigawatt, expanding opportunities in CPUs and networking, and a valuation that did not require multiple expansion for the thesis to work. The note followed meetings with senior management and contributed to the positive institutional backdrop surrounding the record high.
Disclaimer: This content is for informational purposes only and does not constitute investment advice. Investments carry risk. Please do your own research (DYOR).