

Tesla Q3 2026 Earnings: Revenue Stays Flat as Net Income Falls 43%
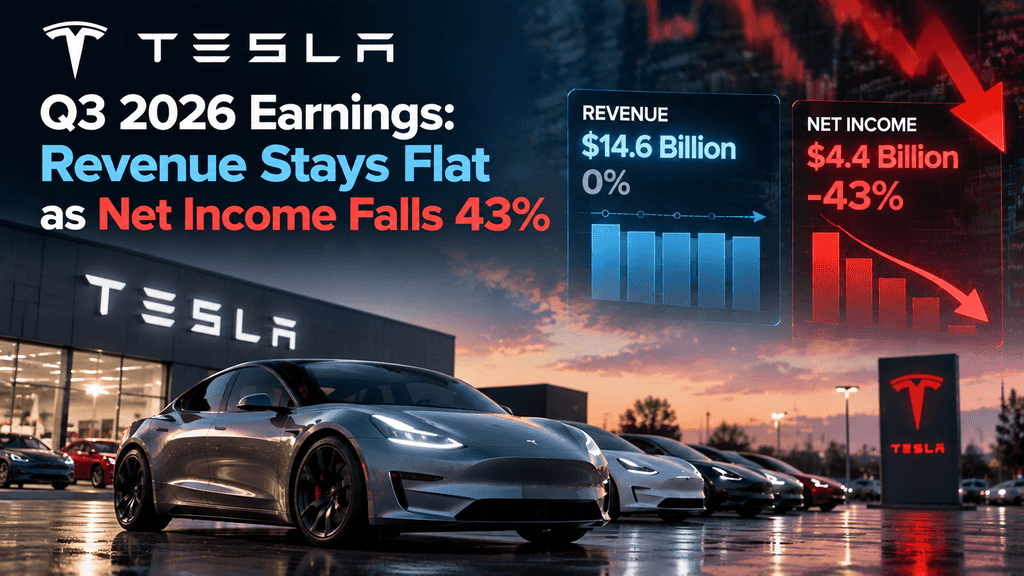
Tesla’s third-quarter 2026 earnings highlight a growing gap between revenue stability and profitability. The electric vehicle maker reported $28.05 billion in revenue for the quarter ended September 30, 2026, virtually unchanged from a year earlier, while GAAP net income attributable to common stockholders fell 43% to $787 million. Operating income dropped 56% to $718 million as operating expenses climbed sharply, putting pressure on margins even as automotive profitability improved on one important measure.
The results present a mixed picture for investors. Tesla generated $1.53 billion in free cash flow, well above market expectations, and adjusted earnings per share of $0.48 exceeded the consensus estimate. However, automotive and energy revenue declined year over year, while spending on artificial intelligence (AI), robotics and autonomous driving remained a major focus. The central question is whether Tesla can translate these long-term investments into sustainable growth without allowing costs to outpace its core business. Its latest results make revenue quality, operating efficiency and the pace of technology commercialization crucial themes for the quarters ahead.
Key Takeaways
-
Revenue remained flat: Tesla generated $28.05 billion in Q3 2026 revenue, compared with $28.10 billion a year earlier.
-
GAAP net income fell 43%: Net income attributable to common stockholders declined to $787 million, while operating income dropped 56% to $718 million.
-
Adjusted earnings beat expectations: Adjusted EPS reached $0.48, above the approximately $0.45 consensus estimate.
-
Free cash flow surprised to the upside: Tesla reported $1.53 billion in free cash flow despite capital expenditures rising 110% year over year to $4.73 billion.
-
Business performance was uneven: Automotive revenue fell 3%, energy generation and storage revenue declined 16%, and services and other revenue grew 33%.
-
AI and robotics remain central to the strategy: Investors will be watching whether investments in autonomous driving, Robotaxi and Optimus can generate meaningful commercial returns.
Tesla Q3 2026 Earnings: Key Financial Results
Tesla’s third-quarter results show that stable revenue does not necessarily translate into stable earnings. Total revenue was $28.046 billion, down marginally from $28.095 billion in Q3 2025. Meanwhile, total gross profit increased 9% to $5.494 billion, suggesting that the company retained some ability to improve production economics. However, operating expenses rose 39% to $4.776 billion, absorbing much of that improvement and contributing to a substantial decline in operating income.
The distinction between GAAP and non-GAAP results is particularly important. GAAP net income attributable to common stockholders fell to $787 million from $1.373 billion a year earlier, and diluted GAAP EPS declined to $0.22 from $0.39. By comparison, non-GAAP net income was $1.697 billion, down 4%, while adjusted diluted EPS slipped to $0.48 from $0.50. These measures use different accounting treatments, so the adjusted figures should not be presented as interchangeable with reported earnings.
| Financial metric | Q3 2026 | Q3 2025 | Year-over-year change |
| Total revenue | $28.05B | $28.10B | Approximately flat |
| Total gross profit | $5.49B | $5.05B | 0.09 |
| Operating expenses | $4.78B | $3.43B | 0.39 |
| Operating income | $718M | $1.62B | -56% |
| GAAP net income attributable to common stockholders | $787M | $1.37B | -43% |
| GAAP diluted EPS | $0.22 | $0.39 | -44% |
| Adjusted diluted EPS | $0.48 | $0.50 | -4% |
| Free cash flow | $1.53B | $3.99B | -62% |
Source: Tesla's Q3 2026 financial summary. Figures are rounded; percentage changes are based on reported values.
Tesla's adjusted EPS exceeded expectations, but the headline earnings decline remains significant. The difference between GAAP and adjusted results also means that investors need to examine which expenses and accounting adjustments explain the gap. The most useful interpretation is not that one metric cancels out the other, but that Tesla delivered better-than-expected adjusted earnings while its reported profitability remained under pressure.
Why Did Tesla's Net Income Fall 43%?
Tesla’s profit decline reflects a combination of rising operating expenses, weaker revenue from two major business segments and increased investment requirements. The company’s operating income fell from $1.624 billion to $718 million, while its operating margin narrowed from 5.8% to 2.6%. The decline was much steeper than the movement in total revenue, indicating that cost growth and the composition of earnings mattered more than the headline sales figure alone.
Rising Operating Expenses Put Pressure on Margins
Operating expenses reached $4.776 billion in Q3 2026, up from $3.430 billion a year earlier. Research and development is an important part of Tesla’s spending profile as the company advances AI, autonomous driving and robotics, although not all of the increase in operating expenses can be attributed to those projects alone. Selling, administrative and other operating costs also contribute to the total. The financial summary establishes the scale of the increase, but a complete explanation requires examining the detailed expense disclosures rather than assigning the entire increase to one initiative.
The resulting margin pressure is straightforward to understand: revenue barely changed, while operating expenses increased by approximately $1.35 billion. Although gross profit improved, the increase was insufficient to offset the larger operating expense base. For investors, this raises a key question about operating leverage. Tesla needs either stronger revenue growth, better cost efficiency or a combination of both to restore operating profitability to previous levels.
Automotive Revenue and Earnings Mix Remain Important
Automotive revenue declined 3% year over year to $20.56 billion, while vehicle deliveries fell approximately 2.1% to 486,532. These figures suggest that the core vehicle business remained under pressure even as deliveries rebounded from the previous quarter. Pricing, model mix, regional demand and the timing of purchases can all influence how delivery volumes translate into reported revenue.
Tesla’s automotive gross margin excluding regulatory credits, however, improved to 18.1%, compared with 15.4% a year earlier. That is an important counterpoint to the decline in net income: the company achieved better profitability on this particular automotive measure, but improvement in one segment-level indicator did not translate into higher consolidated operating income. Investors should therefore avoid assuming that the entire earnings decline was caused by deteriorating vehicle manufacturing economics.
AI Investment Adds a Long-Term Cost and Execution Challenge
Tesla is expanding its ambitions beyond vehicle manufacturing into AI computing, autonomous mobility and humanoid robotics. These projects may create future revenue streams, but they require engineering resources, infrastructure and capital before their commercial returns can be fully assessed. Reuters reported that Tesla’s capital expenditure reached approximately $4.73 billion during the quarter, up 110% year over year.
The distinction between operating expenses and capital expenditures matters here. Operating expenses affect operating income in the period in which they are recognized, while capital expenditures generally represent investment in assets and influence cash flow immediately, with some costs affecting earnings over time through depreciation. Consequently, it would be inaccurate to attribute Tesla’s entire 43% net income decline to capital spending. A more defensible conclusion is that the company faces simultaneous pressure from higher operating expenses and a substantial investment program.
Automotive, Energy and Software Performance
Tesla’s segment-level results reveal an uneven business picture. Automotive and energy generation and storage revenue both declined year over year, while services and other revenue expanded considerably. This divergence suggests that Tesla’s revenue mix is changing, but growth in services has not yet been sufficient to offset weakness in the other two reported categories.
| Business segment | Q3 2026 revenue | Year-over-year change | Key implication |
| Automotive | $20.56B | -3% | Core vehicle revenue remained under pressure |
| Energy generation and storage | $2.88B | -16% | Revenue declined despite higher storage deployments |
| Services and other | $4.61B | 0.33 | A growing source of revenue diversification |
Source: Tesla's Q3 2026 financial summary.
Automotive: Better Margins Do Not Yet Mean Stronger Overall Growth
Tesla produced 464,391 vehicles and delivered 486,532 during the quarter, according to its production and delivery update. Deliveries were lower than the 497,099 recorded in Q3 2025. The year-over-year comparison also reflects an unusually strong prior-year quarter, when some customers brought purchases forward ahead of the expiration of a US federal electric-vehicle tax credit. This comparison effect is relevant, although it does not eliminate the need to assess current demand, pricing and competition.
The improvement in automotive gross margin excluding regulatory credits offers a more encouraging signal. However, Tesla still needs to demonstrate that this improvement can persist while maintaining delivery volumes and competing across price points. Future reports should be assessed using delivery growth, average selling prices, automotive margins and operating income together, rather than treating any single metric as a complete picture of the business.
Energy Storage: Deployment Growth and Revenue Can Move Differently
Tesla deployed 13.7 gigawatt-hours (GWh) of energy storage products in Q3 2026, up from 12.5 GWh in the same period a year earlier. Despite that increase in deployment volume, energy generation and storage revenue fell 16% to $2.881 billion. This difference demonstrates why deployment figures should not be used as a substitute for revenue or profitability measures. Product mix, project timing and recognition of revenue can affect the relationship between units deployed and reported sales.
For Tesla, energy storage remains a potentially important complement to automotive sales, particularly as demand for grid-scale storage and energy infrastructure evolves. However, the third-quarter figures do not support a claim that the segment is already delivering accelerating revenue growth. Investors need to see whether deployments can translate into sustained revenue and stronger margins in subsequent quarters.
Services and FSD: A Growing Part of Tesla's Revenue Mix
Services and other revenue rose 33% year over year to $4.605 billion. This category includes activities beyond vehicle sales, such as services and other offerings, making it an important indicator of how Tesla’s broader business is developing. Yet the category combines multiple activities, so its growth alone does not establish how much revenue came from any single software product.
Tesla’s active Full Self-Driving (Supervised) subscriptions reached approximately 1.74 million, up from 1.04 million a year earlier, according to reported company figures. Subscription growth could support a more recurring revenue model over time, but active subscriptions should not be confused with the proportion of new buyers receiving a feature, nor do they independently reveal average revenue per user or the product’s contribution to net income. The key question is whether subscription growth produces durable, measurable financial benefits.
Why Tesla's Positive Free Cash Flow Matters
Tesla generated $1.531 billion in free cash flow in Q3 2026, even as capital expenditures increased to $4.732 billion. The result was considerably better than the market's prior expectation of substantial cash outflow, according to Reuters. The company also reported $6.263 billion in cash from operating activities and ended the quarter with $45.447 billion in cash, cash equivalents and short-term investments.
Free cash flow and net income measure different aspects of financial performance. Net income is calculated under accounting rules that include non-cash expenses and other items, while free cash flow is generally calculated by subtracting capital expenditures from operating cash flow. A company can therefore report positive free cash flow while net income declines. Tesla's positive result provides evidence of near-term financial capacity, but it does not erase the deterioration in operating income.
Capital spending also came in below analysts’ expectations of approximately $7.5 billion. Reuters reported that Tesla lowered its projected full-year capital expenditure from more than $25 billion to approximately $20 billion. That adjustment helps explain the gap between expectations and actual cash flow, but the available reporting does not establish that a particular AI, robotics or autonomous-driving project was cancelled. The more appropriate interpretation is that Tesla's investment pace and cash generation both warrant attention as the company pursues several capital-intensive initiatives.
Tesla's AI, Robotaxi and Optimus Strategy
Tesla's long-term strategy increasingly depends on whether its investments in AI can generate commercial returns beyond vehicle sales. The company has identified autonomous driving, its Robotaxi service, battery technologies and AI computing as important priorities. These initiatives could expand Tesla's addressable markets, but they also introduce execution risks because technological development, regulatory approval and large-scale commercial deployment do not necessarily occur at the same pace.
Robotaxi: Commercial Scale Is the Key Test
Tesla's Robotaxi ambitions could create a service-based revenue stream if autonomous vehicles can operate safely, reliably and economically at scale. However, investors need to distinguish demonstrations and limited deployments from a mature commercial network. The most relevant indicators include the number of operational vehicles, geographic coverage, regulatory permissions, ride volume, vehicle utilization and the economics of each trip.
Even meaningful technical progress may take time to improve reported earnings. A commercial service needs to cover vehicle costs, maintenance, insurance, computing and operational support while generating sufficient revenue. Until Tesla discloses enough operating data to evaluate those factors, Robotaxi should be treated as a potential growth opportunity rather than an established source of large-scale profit.
Optimus: Potential Manufacturing Benefits Must Be Proven
Tesla's Optimus humanoid robot project reflects the company's ambition to apply its AI and manufacturing expertise to physical automation. In principle, robots could help with repetitive industrial tasks and create opportunities for future external sales. Nevertheless, the financial value of the project depends on reliability, manufacturing cost, useful capabilities and the range of tasks robots can perform in real operating environments.
Investors should look for evidence of production milestones, deployment inside Tesla facilities, measurable productivity improvements and eventual external customer demand. Announced targets or demonstrations are not equivalent to commercial deliveries. Until the company provides clearer evidence of economic returns, Optimus remains a long-term strategic investment whose financial contribution is difficult to quantify.
AI Infrastructure and the Potential Tesla–SpaceX Connection
Tesla's AI strategy also raises questions about computing capacity, infrastructure spending and capital allocation. The potential relationship between Tesla and SpaceX has attracted attention after reports that discussions about a possible combination were being explored. However, exploratory discussions do not establish that a transaction will occur, and any potential deal would need to be evaluated separately from Tesla's current quarterly operating performance.
For investors, the central issue is not simply how ambitious Tesla's technology strategy appears, but whether the company can finance it while maintaining healthy margins and adequate cash generation. AI infrastructure could support future products and services, yet the return on investment will depend on how quickly those capabilities lead to paying customers, operating efficiencies or other measurable economic benefits.
What Tesla Investors Should Watch Next
Tesla's next earnings reports will need to show whether its improving automotive gross margin can translate into stronger consolidated profitability. The Q3 results suggest that revenue growth alone is not enough: operating expenses increased much faster than sales, and operating income fell sharply. Investors should therefore focus on whether Tesla can stabilize operating expenses relative to revenue while sustaining vehicle demand and expanding its higher-growth businesses.
The following indicators will be particularly useful when evaluating future results.
| Indicator | What to monitor | Why it matters | Year-over-year change |
| Vehicle deliveries and average selling prices | Volume growth and pricing trends | Shows whether automotive demand can support revenue growth | Approximately flat |
| Operating expenses and operating margin | Expense growth relative to sales | Reveals whether Tesla is improving operating efficiency | 0.09 |
| Automotive gross margin | Margin excluding regulatory credits | Helps assess underlying vehicle economics | 0.39 |
| Free cash flow and capital expenditure | Cash generation alongside investment requirements | Shows how much financial capacity remains for expansion | -56% |
| Software and autonomous-driving commercialization | Recurring revenue and measurable operating results | Tests whether new technology can support sustainable earnings | -43% |
| GAAP diluted EPS | $0.22 | $0.39 | -44% |
| Adjusted diluted EPS | $0.48 | $0.50 | -4% |
| Free cash flow | $1.53B | $3.99B | -62% |
Tesla's market reaction also illustrates the difference between quarterly results and long-term expectations. Reuters reported that shares initially rose in extended trading following the earnings release, while the Associated Press later reported a decline of approximately 3.2%. The differing snapshots reflect changes during after-hours trading, rather than a contradiction in the underlying financial figures.
Ultimately, investors will need evidence that Tesla can convert its technological ambitions into repeatable financial returns. A sustained recovery would be more convincing if stronger automotive margins, controlled operating expenses and growing service revenue appeared together, rather than as isolated improvements in individual metrics.
Conclusion
Tesla's Q3 2026 earnings reveal a company navigating a difficult balance between current profitability and long-term expansion. Revenue remained virtually unchanged at $28.05 billion, while GAAP net income fell 43% to $787 million and operating income declined 56%. Rising operating expenses and weaker automotive and energy revenue contributed to the pressure, even as automotive gross margin excluding regulatory credits improved and adjusted EPS exceeded market expectations.
The $1.53 billion in free cash flow provides a positive signal about Tesla's near-term financial position, but it does not eliminate concerns about earnings quality or the cost of future growth. AI, Robotaxi and Optimus could expand the company's business opportunities, yet their ultimate value will depend on commercial execution and measurable returns. For investors, the most important question is whether Tesla can turn its technology investments into sustained revenue growth and stronger operating margins. The next few quarters should help clarify whether the current earnings pressure is temporary or reflects a more persistent challenge in the company's evolving business model.
FAQs
When did Tesla release its Q3 2026 earnings?
Tesla released its third-quarter 2026 financial results on October 21, 2026, after the US stock market closed. The quarter covered the three months ended September 30, 2026.
What is the difference between Tesla's automotive gross margin and operating margin?
Automotive gross margin measures the portion of automotive revenue remaining after the direct costs included in the company's automotive cost of revenue. Operating margin measures operating income as a percentage of total revenue after operating expenses are included. The two metrics cover different levels of the business and should not be compared as if they were interchangeable.
Why can Tesla report positive free cash flow while spending billions on expansion?
Free cash flow is calculated from operating cash flow minus capital expenditures. A company can make substantial investments and still generate positive free cash flow if its operating cash inflows are sufficiently large. Positive free cash flow does not necessarily mean that every business segment is profitable or that net income is increasing.
What does non-GAAP earnings mean in Tesla's financial reports?
Non-GAAP earnings are financial measures that adjust reported results for certain items under a company's stated methodology. They can help readers examine selected aspects of operating performance, but they are not a replacement for GAAP results. Investors should review the company's reconciliation of adjusted measures to reported earnings before drawing conclusions.
Why should Tesla's energy storage deployment figures be evaluated separately from revenue?
Deployment measures the amount of storage capacity installed or delivered, while revenue reflects the value recognized from business activity during a reporting period. Differences in product mix, project schedules and revenue recognition can cause deployment volumes and revenue to move in different directions. Tracking both measures provides a more complete view of the segment's performance.
Disclaimer: This content is for informational purposes only and does not constitute investment advice. Investments carry risk. Please do your own research (DYOR).