

STONK Token Burn Hits 17%: How StonkFun’s Buyback Model Is Shrinking Supply
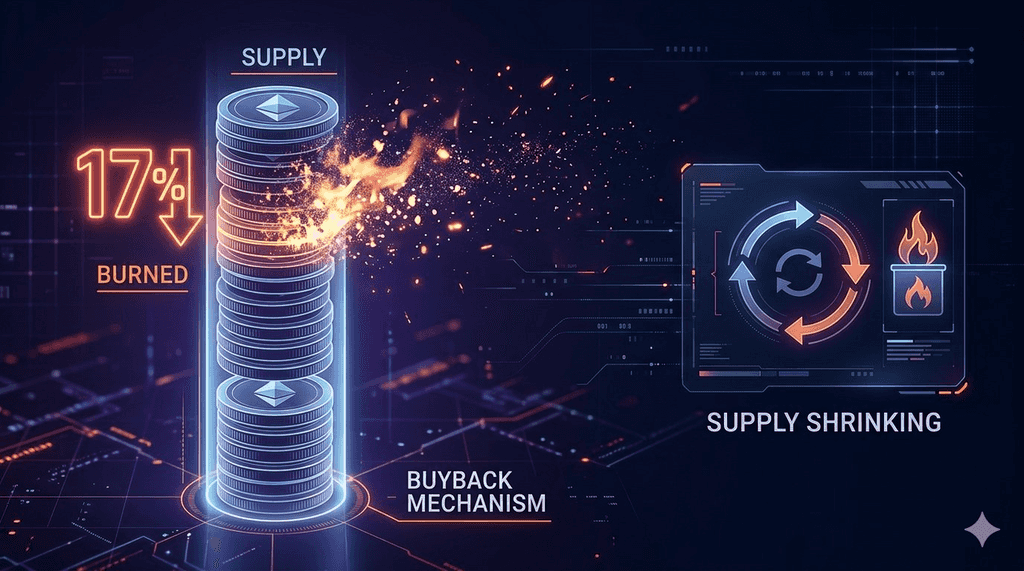
StonkFun, the Solana-based token launch platform focused on pairing new assets with tokenized stocks, commodities, and other real-world references, has reached a notable milestone in its tokenomics. As of late September 2026, official announcements and on-chain metrics confirm that approximately 17% of the original 1 billion STONK supply has been permanently removed. This reduction stems directly from platform trading fees, with roughly 60% of revenue automatically directed toward open-market purchases of STONK followed by irreversible burns. Data from the platform’s revenue dashboard shows cumulative revenue exceeding $21 million, with more than $12.6 million deployed into buybacks that acquired over 170 million STONK tokens across tens of thousands of swaps. The remaining burned portion includes direct fee burns from pools quoted in STONK itself.
Market capitalization fluctuated around the $270–312 million range during the announcement period, reflecting both the supply contraction and elevated trading activity tied to Raydium integrations. The thesis is on point: StonkFun’s automated revenue-to-buyback-to-burn loop creates a structural link between platform usage and STONK scarcity. Higher launch and trading volumes generate more fees, which in turn accelerate supply reduction at a verifiable on-chain pace. This model differs from pure speculative tokens by grounding deflation in actual fee generation rather than discretionary or one-time events. With mint and freeze authorities renounced from launch, supply can only decrease, providing a transparent, one-way pressure that market participants can monitor in real time via public dashboards and Solana explorers.
Platform Revenue Dashboard Reveals Steady Buyback Momentum
StonkFun publishes a live revenue page that tracks traded volumes, fees claimed, buybacks executed, and tokens destroyed. Total volume across all venues has surpassed $2.67 billion, with Raydium pools alone accounting for over $1.71 billion and real-world asset pairs contributing more than $766 million. These figures feed directly into fee collection. Approximately 60% of claimed trading fees convert into STONK purchases on the open market, executed through repeated swaps that are then burned. The dashboard records more than 132,000 such swaps resulting in 170 million tokens acquired for roughly $12.65 million. Direct burns from STONK-quoted launches add further reduction, bringing the destroyed total to about 173 million tokens.
Daily averages around $246,000 in buyback spending illustrate the consistent flow once activity stabilizes. This transparency allows independent verification. Explorers and third-party trackers such as stonk.fyi align closely with the platform’s reported numbers, showing circulating supply near 826–827 million against the fixed 1 billion maximum. Because fees are claimed automatically from locked liquidity positions after launches migrate, the buyback process operates with minimal lag. When launch volumes rise, as they did after the Raydium LaunchLab integration, both revenue and burn velocity increase in tandem. The mechanism therefore embeds scarcity into everyday platform operations rather than relying on scheduled or discretionary events.
Fixed One-Billion Supply and Renounced Authorities Lock in Permanent Reduction
STONK launched with a hard-capped supply of 1 billion tokens. Mint authority was renounced at inception, eliminating any possibility of additional issuance. Freeze authority was similarly nullified, preventing any party from locking individual wallets. These on-chain decisions mean every burn permanently lowers the total supply available for circulation. Early measurements in late August 2026 already showed more than 100 million tokens removed. By mid-September, the figure had climbed past 144 million, or roughly 14.4%, and the September 21 announcement confirmed the 17% threshold had been crossed.
Current tallies place burned tokens near 173.4 million. The absence of mint authority transforms every fee-derived purchase into a lasting supply event. Market participants can query the mint address directly on Solana to confirm the remaining supply at any slot. This verifiability reduces reliance on off-chain statements and supports the claim that scarcity is mechanically enforced. Circulating figures reported by aggregators now reflect the reduced base, so market-capitalization calculations already incorporate the burns rather than the original maximum.
Sixty Percent Revenue Allocation Creates Direct Demand for STONK
The platform’s stated policy routes approximately 60% of trading-fee revenue into open-market STONK acquisitions. The remaining portion is retained for operations. When a launch uses STONK itself as the quote asset, the 60% share burns immediately without an intermediate purchase step. This dual path, buy-then-burn for most pairs and direct burn for STONK-quoted pairs, ensures continuous removal. Cumulative buybacks of $12.65 million have removed the bulk of the 170-plus million tokens, while STONK-quoted fees have contributed several million more.
Because the allocation is programmatic rather than discretionary, buyback pressure scales automatically with platform activity. High-volume days produce larger daily burns; quieter periods slow the rate. The result is a feedback loop in which successful launches generate fees that support the platform token, which in turn can attract further attention to the launchpad. Independent dashboards track the ratio of buybacks to daily volume, often showing double-digit percentages of STONK’s own trading activity attributable to these systematic purchases.
Raydium LaunchLab Integration Accelerated Fee Generation and Burns
In early September 2026, StonkFun became the first third-party platform to integrate with Raydium’s LaunchLab for custom-quote-token launches. Deployment costs fell sharply, from roughly 0.29 SOL to 0.03 SOL, and liquidity migration became automated once bonding-curve conditions were met. Single-day revenue briefly exceeded $1.5 million following the integration, with corresponding spikes in buyback volume. Cumulative revenue climbed rapidly thereafter, supporting the accelerated path toward the 17% burn milestone.
The integration expanded the set of available quote assets while keeping fees flowing into the same burn pathway. Tokenized equities, commodities, and other real-world references gained easier access to Raydium’s concentrated-liquidity infrastructure. Higher launch throughput translated into more locked liquidity positions and therefore more ongoing fee claims. The mechanical link between launch activity and STONK removal remained intact, simply operating at a greater scale.
Ecosystem Flywheel Extends Burns Beyond the Platform Token
In addition to the primary STONK buyback, StonkFun operates an ecosystem flywheel that directs a portion of pool fees toward purchasing and burning the platform’s top tokens by market capitalization. The program is market-cap weighted and runs continuously. Early reports indicated coverage of dozens of tokens, creating secondary deflationary pressure across the broader set of assets launched on the platform.
Holder rewards distributed in quote assets further align incentives for participants in individual launches. This layered approach means activity on any successful launch contributes both to STONK burns and to the health of other ecosystem tokens. The flywheel does not divert the core 60% allocation away from STONK; it supplements it. Over time, the combination can reinforce network effects, as communities see tangible value return through both the platform token and their own holdings.
Market Capitalization Response Followed the 17% Announcement
On the day the 17% burn figure was publicized, STONK’s market capitalization was reported near $312 million with a 24-hour gain exceeding 26%. Subsequent snapshots showed values fluctuating in the mid-to-high $270 million range as price adjusted. A circulating supply near 826 million tokens implies a per-token price in the vicinity of $0.33 under those conditions. Earlier milestones, such as the 14% burn level, had coincided with moves toward $0.30 and temporary rankings among the top 150 cryptocurrencies by capitalization.
Price discovery occurs primarily against the SPYx pair on Raydium, introducing an equity-market beta component. Dollar valuations therefore reflect both STONK’s relative performance versus the tokenized index and the absolute reduction in supply. Buyback pressure provides a continuous bid, yet overall market sentiment and broader Solana activity continue to influence short-term movements.
On-Chain Verification Confirms Alignment Between Dashboard and Blockchain
Independent assessments of the STONK mint supply on the Solana blockchain consistently align with or closely follow the totals reported by the platform regarding burned tokens. Detailed slot-level queries conducted in late August revealed that approximately 102 million tokens had already been removed from circulation. Following this, subsequent measurements documented the increase in burned tokens, first reaching 14% and then climbing to 17%. Additionally, various third-party websites, such as stonk.fyi, provide real-time updates on burn events, velocity percentages, and cumulative figures that correspond with the official revenue page of the platform.
This consistent alignment significantly enhances confidence in the underlying mechanism. Since the token burns are executed directly on-chain and the mint authority has been renounced, the reduction in supply is both irreversible and publicly auditable. As a result, market participants are not required to place their trust in off-chain claims; they have the ability to verify the remaining supply at any time through standard Remote Procedure Call (RPC) methods or by utilizing block explorers. This transparency ensures that all stakeholders can independently confirm the accuracy of the reported data, fostering a greater sense of trust and reliability in the system.
Daily Burn Velocity Reflects Platform Activity Levels
Burn velocity has shown significant variation in relation to revenue generated. During periods characterized by elevated launch volume, the burn rates reached impressive levels, nearing 0.3% of the total supply per day or even exceeding that threshold. However, more recent observations indicate that these rates have settled closer to approximately 0.15% on a daily basis as overall activity has normalized following the initial surge experienced during the LaunchLab phase. Even at this lower rate, the continued operation of the platform steadily compounds the reduction in supply over time.
Projections that are based on recent seven-day averages suggest that several additional percentage points of supply could potentially be removed in the coming weeks, provided that revenue levels remain stable. It is important to note that velocity is not a constant figure; rather, it fluctuates in accordance with the generation of fees. Consequently, the model remains highly sensitive to the overall success of the platform. Sustained periods of high activity would serve to accelerate the process of scarcity, while slower periods would naturally moderate the pace of supply reduction. The absence of a fixed schedule for operations ensures that the entire process remains tightly coupled to real usage patterns, reflecting the actual engagement and activity levels on the platform.
Holder Base Expansion Accompanies Supply Contraction
Holder counts have experienced significant growth, now reaching an impressive total of approximately 91,800 unique addresses, as indicated by the latest data from tracking sources. The metrics related to average holdings and distribution patterns suggest a widening base of ownership, even as the overall supply of tokens continues to decrease. The concentration of assets among the largest wallets remains at a moderate level when compared to many other tokens in the market, with the holdings of the top ten wallets reported to be around 18%.
This combination of increasing ownership and a declining supply can significantly enhance the impact of ongoing token burns on various per-token metrics. The growth in the number of holders frequently follows notable visibility events, such as the recent announcement of a 17% increase or new listings on exchanges. The continuation of this positive trend is contingent upon sustained activity related to launches and the perceived reliability of the burn mechanism in place. The on-chain characteristics of both the reduction in supply and the tracking of holders provide a level of transparency that is ongoing and beneficial for all stakeholders involved.
StonkFun’s Position Among Solana Launchpads
StonkFun operates within a highly competitive and dynamic environment of Solana launchpads, where numerous platforms vie for user attention and investment. Its unique differentiation stems from the innovative custom-quote model it employs, along with a clear and explicit allocation of a significant percentage of its revenue directly towards its own token burns. This strategic approach sets it apart from other platforms that may focus on various fee splits or alternative reward structures. The distinctive combination of a fixed supply of tokens, renounced authorities, and an automated buyback mechanism that allocates 60% of revenue to buybacks creates a remarkably unique deflationary profile that is not commonly found in the market.
Lifetime revenue figures and the percentages of tokens burned position StonkFun among the more active fee generators within its category during the observed period, showcasing its effectiveness in generating revenue while simultaneously reducing supply. As competition continues to evolve and adapt, platforms that maintain transparent and high-velocity burn programs are likely to attract users who are actively seeking measurable scarcity in their investments. Conversely, those platforms that prioritize other features may choose to emphasize different value propositions that appeal to various segments of the market. The direction that STONK has taken thus far illustrates one viable and promising path that effectively links the economics of the platform directly to the dynamics of token supply, creating a compelling narrative for potential investors and users alike.
Monitoring Supply Dynamics and Market Effects
Participants tracking STONK can rely on three primary data sources: the official revenue dashboard for fee and buyback totals, Solana explorers for mint-supply confirmation, and independent metric sites for velocity and holder statistics. Cross-referencing these sources yields a consistent picture of progressive reduction. Because burns occur continuously rather than in large discrete events, the process tends to produce gradual rather than abrupt supply shifts.
Monitoring daily or weekly changes in burned percentage, revenue, and circulating supply provides early signals of momentum shifts. The mechanical nature of the allocation means that sustained platform growth should continue to translate into further scarcity, while any prolonged decline in launch activity would slow the rate. Transparency of the data flow supports informed observation without reliance on unverified projections.
Long-Term Structural Effects of Continuous Fee-Driven Burns
Over extended periods, the cumulative effect of the 60% allocation can become material. Removing 17% of supply within roughly two months of intensified activity demonstrates the potential scale. If revenue remains elevated, additional double-digit percentage reductions remain plausible over subsequent quarters. The renounced mint authority ensures that every such reduction is permanent.
Structural scarcity does not guarantee price appreciation; market demand must absorb remaining supply. Yet the consistent removal of tokens reduces the quantity available at any given price level. Combined with an expanding holder base and ongoing platform utility, the model creates conditions under which sustained usage can exert upward pressure on scarcity metrics. The ultimate outcome depends on continued execution of the fee-to-burn pathway and broader market conditions surrounding Solana-based assets.
Conclusion
The public nature of both the revenue dashboard and the on-chain burn transactions distinguishes this approach. Users can observe individual swap and burn transactions in near real time. Aggregate statistics are updated continuously. Disclaimer language on the platform notes that past purchases do not obligate future activity beyond the programmed allocation, yet the historical record remains fully visible.
This level of openness allows market participants to form independent assessments of the mechanism’s effectiveness. Claims of supply reduction can be checked against blockchain data rather than accepted on trust. In an environment where tokenomics statements are frequently difficult to verify, the combination of automated execution and public ledgers provides a higher standard of accountability.
🔥 Beyond the Headlines: What KuCoin 5.0 Means for You
Market news moves fast — but where you act on it matters just as much. This October, KuCoin launches KuCoin 5.0, transforming KuCoin into a rebuilt platform. Here's what actually changes for you:
-
One account for everything. Older platforms split your money across separate "spot," "margin," and "futures" accounts and expected you to understand why. KuCoin 5.0's unified account removes that entirely — deposit once, and everything is simply there (only available to VIPs for now).
-
Stocks, indices, and commodities. KuCoin 5.0 expands beyond crypto into global markets. When crypto chops sideways and equities rally (or the reverse), you rotate in minutes instead of opening a brokerage account and waiting days for fiat rails.
-
Real-world assets (RWA). Tokenized exposure to traditional assets like commodities, right inside your crypto account. One of the fastest-growing segments in global finance is no longer reserved for institutions — you access it from the same balance you trade with.
-
Earn while you learn. Not ready to trade? KCUSD lets your stablecoins earn daily, auto-compounding interest. The lowest-stress way to put your idle deposit to work for 4% yield.
-
An AI assistant in plain language. Ask questions, get market context, understand what you're looking at — built into the platform, no jargon required.
-
An app that doesn't overwhelm. Faster, cleaner, and consistent — intuitive from the first tap, not after a tutorial.
-
Safety you can check, not just trust. A MiCAR-licensed EU entity, Proof of Reserves you can verify yourself, and internationally certified security (SOC 2 Type II, ISO 27001:2022).
Create your account in minutes — and start on the platform built for where crypto is going, not where it's been.
FAQs
How exactly does the 60% revenue allocation translate into STONK burns?
Platform trading fees are claimed automatically from locked liquidity positions after launches. Approximately 60% of those fees are used to purchase STONK on the open market through a series of swaps. The acquired tokens are then sent to a burn address and permanently removed. When launching a quote for STONK itself, the corresponding fee share burns directly without a purchase step.
What is the current burned percentage and remaining circulating supply?
As of the most recent platform and tracker data in late September 2026, roughly 173.4 million STONK have been burned, equating to about 17.3% of the original 1 billion supply. Circulating supply stands near 826–827 million tokens. These figures can be verified by querying the mint supply on Solana and cross-checking against the official revenue page.
Does the burn rate remain constant over time?
No. Burn velocity scales with platform fee generation. High-activity periods after integrations or successful launch waves produce higher daily percentages removed. Quieter periods slow the rate. Recent observations have ranged from under 0.2% to above 0.3% of supply per day depending on revenue levels. The process is continuous but activity-dependent.
How can the burned amount be independently verified?
Query the STONK mint address on any Solana block explorer or RPC endpoint to obtain the current total supply. Subtract that figure from the fixed 1 billion maximum. The difference equals tokens destroyed. Platform dashboards and third-party sites provide additional transaction-level detail that should reconcile closely with the on-chain total.
Disclaimer
The information provided on this page may originate from third-party sources and does not necessarily represent the views or opinions of KuCoin. This content is intended solely for general informational purposes and should not be considered financial, investment, or professional advice. KuCoin does not guarantee the accuracy, completeness, or reliability of the information, and is not responsible for any errors, omissions, or outcomes resulting from its use. Investing in digital assets carries inherent risks. Please carefully evaluate your risk tolerance and financial situation before making any investment decisions. For further details, please consult KuCoin’s Terms of Use and Risk Disclosure.