

Russian Stock Market Falls for Six Consecutive Months: Why the MOEX Index Is Declining and What Comes Next
Introduction
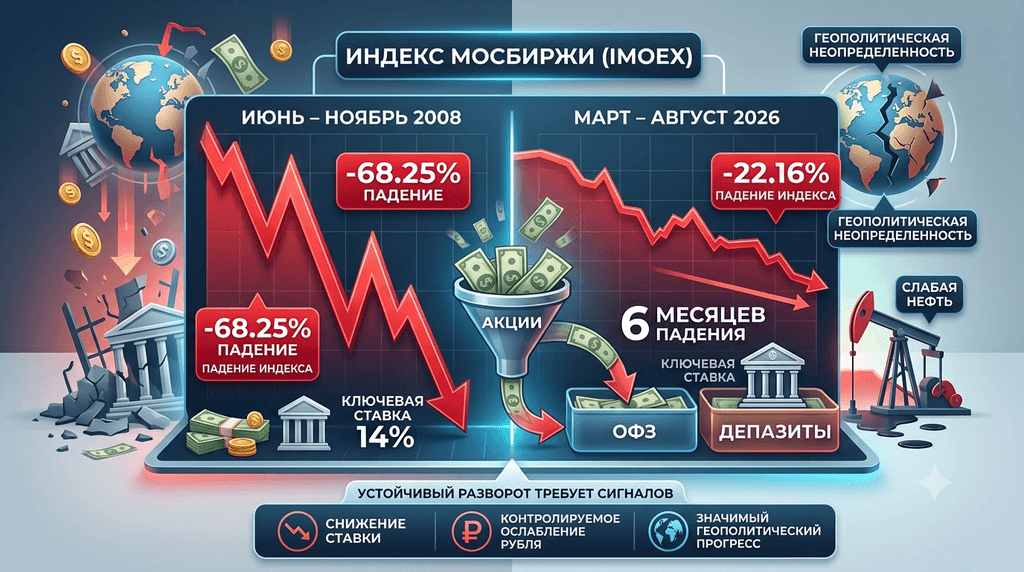
Can a market fall for six consecutive months without experiencing a full-blown crash? Yes. From March to August 2026, the MOEX Russia Index fell by 22.16%, completing its longest period of continuous decline since 2008. For comparison: from June to November 2008, the index lost 68.25% against the backdrop of the global financial crisis. Thus, the current situation has a crisis-like duration—but not yet a crisis-like scale of losses.
The main reason for the current decline in the Russian stock market lies not in a single sudden shock, but in a gradual outflow of liquidity. With the key rate at 14%, bank deposits and OFZs continue to compete with equities by offering attractive yields without comparable market risk. Geopolitical uncertainty, weak oil prices, expensive credit, and the absence of a new growth driver compound the pressure. In the base scenario, the MOEX Index will form a base in a broad range of 2,000–2,300 points in the near term, while a sustainable trend reversal will require stronger signals.
Why Is the MOEX Index Falling for the Sixth Month in a Row?
The MOEX Index is falling because demand for Russian equities has proved weaker than supply, while alternative ruble instruments remain highly attractive. According to data from RBC Investments as of August 31, 2026, the IMOEX lost 22.16% over six months, from March to August. On the last trading day of August, the index rose by 3.02% to 2,178.87 points, but this bounce did not cancel the general downward trend.
Stock selling is not driven solely by worsening expectations for individual companies. Investors are simultaneously re-evaluating the valuation of the entire market: future cash flows are discounted at a high key rate, the geopolitical premium remains substantial, and forecasts for commodity exporters are becoming less confident. In such an environment, even a strong corporate earnings report does not always translate into sustainable price gains.
What Does the Record Duration of the Decline Mean?
Six months of continuous decline is a rare market sequence, but in itself, it does not prove an impending financial panic. In 2008, the MOEX Index fell from June to November, losing 68.25%. Back then, the decline was part of a global liquidity crisis, where problems in the banking system and credit markets rapidly spread to equities, commodities, and currencies.
In 2026, the accumulated decline amounted to 22.16%. This is significantly less than the historical crash of 2008 and closer to a prolonged contraction of valuations than a one-time fire sale. In other words, the current dynamic represents a crisis-length decline, but not a crash of crisis scale.
How Does the 2026 Situation Differ from 2008?
The key difference lies in the nature of the pressure. In 2008, global liquidity dried up abruptly, triggering panic selling and a chain reaction throughout the financial system. In 2026, the market is experiencing a gradual drying up of liquidity: capital is shifting from risky equities to bank deposits and bonds as long as high interest rates make this substitution rational for investors.
| Period | Duration of Decline | Accumulated IMOEX Change | Primary Mechanism |
| June–November 2008 | 6 months | -68.25% | Global liquidity crisis and panic sell-off |
| March–August 2026 | 6 months | -22.16% | Outflow into risk-free instruments, high key rate, and uncertainty |
The comparison shows why headlines about a "record" require careful interpretation. The market has indeed matched the historical duration of a losing streak, but the magnitude of losses is not comparable. Therefore, it is more accurate to speak of a prolonged exhaustion of demand and suppressed valuations rather than a replay of the global financial crisis.
Why Isn't the 14% Policy Rate Bringing Money Back to Equities?
A 14% policy rate does not guarantee a flow of capital into equities because deposit and bond yields remain high relative to uncertain stock market returns. As Freedom Global analyst Vladimir Chernov noted in a commentary for RBC Investments on August 31, 2026, even after the rate cut, bank deposits and bonds remain quite attractive, leaving investors with little reason to abandon fixed income in favor of riskier securities.
This works through a substitution effect. When a deposit or an OFZ yields a high nominal rate, a stock must offer not only potential price growth but also a premium for volatility, geopolitics, currency risk, and the probability of weak dividends. If the expected premium is insufficient, capital remains in instruments with pre-determined cash flows.
How OFZs and Bank Deposits Are Crowding Out the Stock Market
OFZs and bank deposits crowd out equities not through direct restrictions on buying, but by elevating the hurdle rate of attractiveness. Investors compare the expected return of a stock against the return achievable without daily mark-to-market risk. With the rate at 14%, this bar remains high.
Indirect confirmation of this competition for liquidity comes from the debt market. According to Kommersant data from September 2, 2026, corporate bond placements in August exceeded 875.1 billion rubles—a record for August and approximately one-third higher than last year's figure. While a placement record alone does not prove that all funds were diverted from stocks, it highlights the scale of fixed-income supply and the intense competition for ruble capital.
The situation may also remain tight for the OFZ market. Kommersant reported that the Ministry of Finance's planned return to floating-rate OFZ placements on September 2 could further escalate liquidity competition. As long as investors prefer fixed or relatively predictable cash flows, equities must present a far more compelling fundamental narrative.
What Needs to Change for Capital to Return to Equities?
For a sustainable rotation back into stocks, rate cuts must be sufficiently rapid and noticeable in real risk assessments. A single minor rate reduction is insufficient if deposit and bond yields stay high while investors see no improvement in corporate earnings.
Consequently, the market will monitor not only the current rate level, but the overall trajectory of monetary policy. If the Bank of Russia begins cutting rates faster than expected, future equity cash flows will become more valuable, and the appeal of long-duration bonds will shift. However, this channel operates effectively only if the geopolitical risk premium declines simultaneously.
How Geopolitics Amplifies Market Decline
Geopolitics amplifies market declines because it maintains a high uncertainty premium and makes every positive move dependent on news headlines. According to Alexey Golovinov of Vector Capital, quoted by RBC Investments on August 31, 2026, there are almost no reasons left to buy shares: the negotiation process is stalled, the geopolitical premium has not disappeared, and the high interest rate creates fierce competition from bonds and deposits. This uncertainty affects stocks in two ways: first, it increases the investor's required rate of return, thereby lowering the fair value of future earnings; second, it shortens planning horizons, leading participants to defer purchases due to doubts over regulations, foreign trade, currency earnings, and future economic policy.
The market can also react sharply to short-term diplomatic signals. On August 31, the IMOEX rose by roughly 3% on rumors of intensifying negotiations, but without confirmed substantive results, such momentum remains unstable. High-level visits and mutual statements can trigger local rebounds, but a full-fledged reversal requires real diplomatic progress, not just emotional news triggers.
Why Post-Election Uncertainty Matters to Investors
Post-election uncertainty matters because investors lack clarity on the economic decisions that will define the next phase. Even with stable current reporting, the market can remain defensive if participants do not know how taxes, budget spending, exporter requirements, industry regulation, and financing terms will evolve.
Such an effect does not necessarily cause a sharp crash. More often, it reduces new buying activity and heightens sensitivity to negative news. As a result, the market drifts lower gradually: each individual factor seems insufficient to trigger a collapse, yet their cumulative effect sustains pressure month after month.
How Oil and Corporate Profits Affect the Russian Stock Market
Weak oil prices impair the outlook for Russian equities by squeezing revenues and earnings among resource majors. RBC Investments, citing Freedom Global, noted that declining oil prices and a weak external environment presented additional headwinds for commodity issuers in the summer of 2026.
This is particularly critical for the index because large oil and gas companies carry heavy weightings and shape expectations for overall earnings, dividends, and tax revenues. When oil weakens, investors price in lower export receipts, weaker free cash flow, and more conservative dividend policies.
The exchange rate partially offsets this effect: ruble depreciation increases the local-currency value of export revenues. According to Frank Media data from September 1, 2026, the ruble weakened by 22.1% against the US dollar from late May to August 31, while the MOEX Index fell 15.1% over the same summer period to 2,176.92 points. However, devaluation is not an automatic positive factor. It can simultaneously accelerate inflation, keep interest rates elevated, and raise the cost of imported equipment.
Why Strong Individual Earnings Reports Don't Rescue the Broader Index
Strong individual corporate reports cannot rescue the overall index when broader market valuations depend more heavily on macroeconomic conditions than on the current earnings of a single issuer. Freedom Global notes that while strong results help individual equities, they fail to generate a general growth catalyst for the entire market.
Investors evaluate not only historical or current earnings, but also their sustainability. If expensive credit suppresses investment and demand while geopolitics complicates export visibility, a single solid quarterly report cannot guarantee sustained price appreciation. Hence, the market may selectively buy individual stocks while continuing to drag the broader index down.
Where Is the MOEX Index Consolidation Range?
The baseline short-term range for the MOEX Index sits approximately between 2,000 and 2,300 points. This range was cited by Cifra Broker in a report published by RBC Investments on August 31, 2026. Freedom Global estimated a narrower operational range of around 2,000–2,200 points, warning of potential re-tests of the lower boundary absent a strong new catalyst.
Thus, the immediate scenario looks more like a broad base-building phase than an immediate V-shaped recovery. Over a horizon of several months, assuming continued rate cuts and no geopolitical deterioration, a return to 2,250–2,350 points is possible, though analysts do not expect a quick return to former highs.
What Three Signals Could Break the Downward Trend?
The first signal is a faster-than-expected policy rate cut. In this case, risk-free yields would quickly lose their advantage, reducing the discount rate applied to equities. What matters most to the market is surprise and consistency of action—not just a pre-priced move to 14%.
The second signal is moderate ruble depreciation. A weaker national currency can bolster the ruble revenue of exporting companies and enhance their relative profitability. However, overly sharp devaluation would be perceived as a macroeconomic risk, making controlled currency adjustments the key positive catalyst.
The third signal is substantive progress in geopolitical negotiations. This must entail concrete agreements or a sustained reduction in uncertainty, rather than mere visits, statements, or short-lived surges in sentiment. Only such progress can shrink the risk premium and expand investment horizons.
KuCoin Offers A More Stable Option in A Volatile Market
If you worry about the frequent ups and downs in the market, and pursue a more stable option to earn money passively, KuCoin is the right place to come:
Simple Earn: Deposit and withdraw tokens anytime, earning stable returns.
Kucoin Earn: Earn stable profits with professional asset management.
Hold to Earn: Earn rewards by holding assets in Funding, Trading, Margin, Futures, Mining, and Unified Accounts.
Staking: Unlock the earning potential of on-chain assets.
Advanced Investments: Advanced Investments offer a variety of structured products to help your money grow in any market.
Shark Fin: Principal Protection and Guaranteed Gains
Dual Investment: Buy low and sell high with transparent return calculations.
Snowball: High yields, with price protection.
Discount Buy: Buy crypto at discount prices.
KCS Loyalty: Level up to enjoy exclusive perks by staking ≥ 1 KCS.
KuCoin Wealth: Discover future value and begin your smart investing journey.
KCS Benefits: Hold and stake KCS to access benefits across the platform.
KCS Staking 2.0: Participate in KCS on-chain governance to earn yield.
Conclusion
The Russian stock market has indeed experienced its longest streak of decline since 2008: the MOEX Index fell for six consecutive months, losing 22.16% between March and August 2026. However, a comparison with 2008 highlights a fundamental difference. Back then, the index plummeted 68.25% in six months due to a global liquidity crisis and panic selling. Today, the market is declining more gradually: high capital costs, a rotation into bank deposits and OFZs, geopolitical uncertainty, weak oil prices, and a lack of new profit catalysts are the primary drivers.
A 14% key rate has not yet provided sufficient impetus for equities, as risk-free instruments retain strong competitive appeal. In the near term, the base case remains a broad 2,000–2,300 point range and gradual base formation rather than a swift V-shaped rebound. A lasting reversal will require three conditions: faster rate cuts, controlled ruble weakness, and tangible diplomatic progress. Until these signals emerge, the market remains vulnerable to renewed waves of selling, even if individual stocks stage temporary gains.
Frequently Asked Questions
1. What is the MOEX Russia Index?
The MOEX Russia Index (IMOEX) is a ruble-denominated benchmark that tracks the performance of the most liquid and significant stocks traded on the Moscow Exchange. It serves as an indicator of overall Russian equity market trends, though it does not reflect the performance of every individual investor.
2. Why does the RTS Index typically fall more sharply than IMOEX during ruble weakness?
The RTS Index is calculated in US dollars, making it sensitive to both stock prices and the ruble exchange rate. When the ruble depreciates, the dollar value of Russian stocks drops even if their ruble-denominated prices experience smaller changes. Consequently, currency movements can amplify RTSI declines relative to the IMOEX.
3. What are OFZs?
OFZs (Federal Loan Bonds) are ruble-denominated sovereign debt obligations issued by the Russian Federation. Their yields depend on prevailing interest rates, inflation expectations, maturity dates, and demand for government debt. OFZs are generally considered lower-risk instruments compared to individual stocks, though they are not entirely risk-free.
4. How does a market correction differ from a crash?
A correction is a noticeable decline following a period of gains or valuation reassessment, which often unfolds gradually without causing a systemic financial crisis. A crash is characterized by rapid price drops, liquidity disruptions, and panic selling. Because the boundary between the two is not defined by a single numeric threshold, analyzing the speed of decline, trading volumes, and overall financial system health is essential.
5. Why doesn't a single-day market gain confirm a trend reversal?
A single-day gain may be a transient reaction to news, short-covering, or a technical bounce following heavy selling. A true reversal requires confirmation: a series of higher lows, sustained liquidity inflows, improved earnings expectations, and a reduction in core macro risks. Without these indicators, a single strong trading day is best viewed as a localized fluctuation rather than the onset of a new long-term trend.
Disclaimer : This material is provided for informational purposes only and does not constitute financial, investment, legal, or tax advice. Transactions involving cryptocurrencies and tokenized assets carry substantial risks — including price volatility, limited liquidity, counterparty exposure, and the potential for total loss of invested capital. Readers should conduct their own research and, where appropriate, consult a qualified professional before making any financial decisions.