

When Will the Philadelphia Semiconductor Index (SOX) Bottom Out? Key Signals from the Semiconductor Bear Market
2026/07/30 12:06:00
Introduction
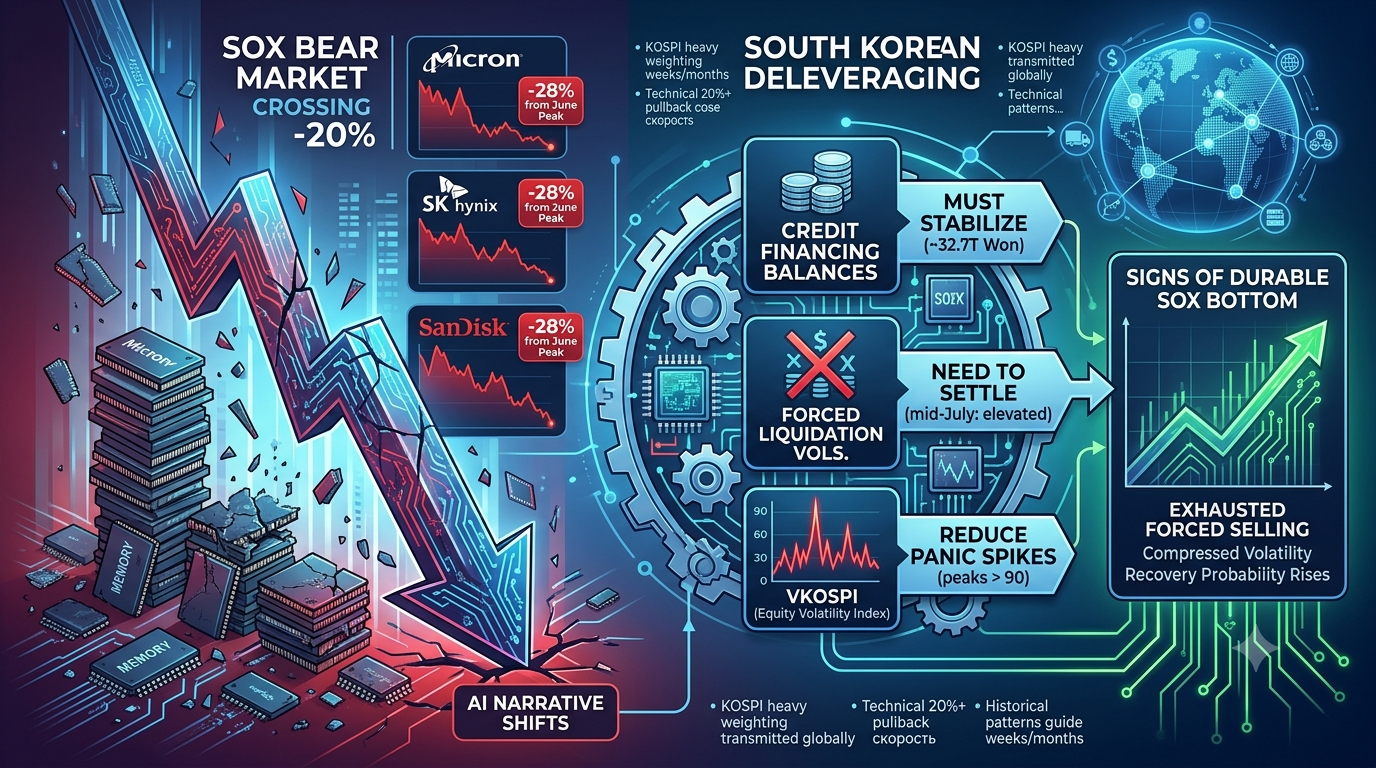
The Philadelphia Semiconductor Index (SOX) has plunged more than 28% from its June 22, 2026, all-time closing high of 14,634.72, settling near 10,447.49 as of late July. Memory chip leaders including SK Hynix, Micron, and SanDisk continue facing sharp price pressure amid the broader sell-off. Investors now face one urgent question: when will the SOX stop falling? The index has already entered a technical bear market after crossing the 20% decline threshold, and recovery hinges largely on the end of South Korea’s ongoing deleveraging cycle in semiconductor-related stocks.
What Defines a Technical Bear Market for the SOX?
A technical bear market occurs when an index or asset falls 20% or more from a recent significant high, measured by closing prices. This definition focuses purely on price action rather than economic recession signals.
The SOX hit its record close of 14,634.72 on June 22, 2026. The 20% threshold calculates to 11,707.78 (14,634.72 × 0.80). On July 17, the index closed at 11,673.89, confirming the technical bear market. Subsequent sessions pushed it further to around 10,447.49, well below the line. According to market data from July 2026 sources, this marks one of several 20%+ pullbacks the SOX has experienced in the past decade, though the speed of the current decline stands out after a strong year-to-date rally.
This classification ends the previous “all-in on AI” narrative that dominated earlier in 2026. Price action alone confirms the bearish phase, yet it provides no automatic timeline for a bottom. Further analysis of underlying drivers is required.
Why Has the Memory Chip Sector Led the SOX Decline?
Memory chip stocks have driven much of the SOX weakness because of concentrated exposure to AI-related demand expectations and heavy retail leverage in key Asian markets. SK Hynix, Micron, and SanDisk experienced repeated price pullbacks in July 2026 sessions, reflecting profit-taking after sharp earlier gains and spillover from South Korean market volatility.
South Korea’s KOSPI, heavily weighted toward Samsung Electronics and SK Hynix, has amplified the pressure. These two names represent a large share of the index, so local selling transmits quickly to U.S.-listed semiconductor peers and the SOX. Recent earnings from SK Hynix showed strong year-over-year growth in high-bandwidth memory but still missed some consensus estimates, triggering additional downside. Data from late July 2026 indicates U.S. memory names frequently moved in sympathy with overnight Korean sessions, producing multi-percentage-point declines in single days.
The broader semiconductor complex remains up significantly on a year-to-date basis in many cases, yet the rapid reversal from June highs has shifted sentiment from unrestricted AI optimism to caution around valuations and positioning.
How Does South Korean Deleveraging Affect the SOX Bottom?
South Korean retail deleveraging must largely conclude before the memory sector and SOX can stabilize on a sustained basis. Korean individual investors used margin financing and single-stock leveraged ETFs to build large positions in Samsung and SK Hynix earlier in 2026. Margin loan balances rose from roughly 27.4 trillion won in early January to a peak of 38.6 trillion won on June 24, according to Korea Financial Investment Association figures reported in July 2026.
Sixteen single-stock 2x leveraged ETFs focused on Samsung and SK Hynix launched on May 27. Retail net buying in these products reached approximately 13.67 trillion won while institutions sold. These ETFs rebalance daily by adding exposure on up days and reducing it on down days. Once prices reverse, the mechanism creates a negative feedback loop: falling prices trigger margin calls, forced selling, and further declines.
This process has spilled into global semiconductor pricing because Korean chipmakers sit at the center of AI memory supply chains. Until the forced selling pressure eases, SOX downside risk remains elevated even if fundamental AI demand stays intact.
What Signals Indicate the End of Korean Deleveraging?
Three observable metrics offer the clearest evidence that deleveraging is nearing completion: credit financing balances, forced liquidation volumes, and the VKOSPI volatility index. Stabilization across these series would reduce mechanical selling pressure on Samsung, SK Hynix, and related U.S. peers.
Credit financing balances peaked at 38.6 trillion won on June 24 and stood near 32.7 trillion won by July 23. The decline shows progress, yet balances remain elevated. A true signal requires the series to stop falling and begin to stabilize rather than continue contracting.
Forced liquidation amounts rose from about 550.8 billion won in March to 1.12 trillion won in June. July’s first half registered roughly 473.6 billion won, with the share of forced liquidations relative to receivables dropping to 1.4% on July 22 (a 4.3 percentage-point month-over-month decline). Volumes need to settle into a lower normal range, typically several hundred billion won or less per month, for pressure to ease meaningfully. July data through mid-month already showed elevated activity, and lag effects from large single-day drops mean additional liquidations can appear later.
The VKOSPI, South Korea’s equity volatility index derived from KOSPI 200 options, measures expected near-term market swings. It has spiked to levels several times higher than the U.S. VIX during the recent turbulence, reaching peaks above 90 in some sessions. A sustained retreat toward more typical ranges would signal reduced panic and lower forced-selling intensity.
As of late July 2026, these indicators have not fully normalized. The KOSPI has triggered circuit breakers multiple times within the year, producing repeated sharp up and down swings. Such volatility patterns are characteristic of the middle-to-late stages of a deleveraging cycle, when selling intensity may moderate but underlying leverage structures remain unsettled.
How Long Could the SOX Bear Market Last Based on Historical Patterns?
Historical SOX pullbacks of 20% or more have varied in length, often lasting weeks to several months depending on the catalyst and broader market conditions. The current episode differs because of the concentrated leverage unwind in Korea rather than a pure demand slowdown.
Previous cycles frequently saw bottoms form once forced selling exhausted and volatility compressed. In the present case, the combination of still-elevated Korean margin balances and elevated VKOSPI readings suggests the process has further to run. Market commentary from July 2026 notes that while AI-related fundamentals for high-bandwidth memory remain supportive over longer horizons, near-term price action stays hostage to positioning and liquidity dynamics.
No precise calendar date exists for a bottom. Progress on the three Korean metrics above provides the most practical real-time guide. Once credit balances stabilize, liquidation volumes normalize, and VKOSPI retreats, the probability of a durable SOX low increases substantially.
Should You Trade Semiconductor-Related Assets on KuCoin?
KuCoin offers access to a range of cryptocurrency products that track or correlate with technology and AI themes often linked to semiconductor demand cycles. Users can explore trading pairs, futures, or related tokens once market conditions clarify. Registration on KuCoin provides tools for portfolio diversification, real-time data, and risk management features that support active monitoring of sector volatility.
Join KuCoin 9th Anniversary Trading Campaign
KuCoin is celebrating its 9th anniversary with a special platform campaign filled with exclusive rewards, trading activities, and limited-time offers. Don’t miss the chance to participate and enjoy the benefits as the exchange marks nine years of growth and innovation. Visit the official campaign page now:
Conclusion
The Philadelphia Semiconductor Index has entered a confirmed technical bear market after falling more than 20% from its June 22, 2026, peak of 14,634.72 and reaching levels near 10,447 in late July. Memory chip stocks have led the decline, amplified by South Korean retail deleveraging through high margin balances and leveraged ETFs. Credit financing peaked at 38.6 trillion won and has only partially retreated, forced liquidations remain elevated relative to normal periods, and VKOSPI volatility stays high.
These three signals must show clearer stabilization before a durable bottom becomes likely. Historical patterns indicate such processes can take additional weeks or months. Investors should monitor Korean margin data, liquidation volumes, and volatility closely rather than relying solely on the “AI narrative.” Once deleveraging pressure eases, the SOX may find support, but residual fundamental and macroeconomic risks will still require careful evaluation.
FAQs
Does a technical bear market guarantee further large declines?
No. It only confirms a 20% or greater drop from a recent high and does not predict the ultimate depth or duration of the move.
Why do Korean margin loans matter for U.S. semiconductor stocks?
Samsung and SK Hynix form a major part of the global memory supply chain. Forced selling in Korea transmits price pressure to related U.S.-listed names and the SOX.
Can AI demand alone reverse the current SOX decline?
Strong underlying AI memory demand supports longer-term fundamentals, yet near-term price recovery still depends primarily on the completion of the Korean deleveraging process.