

Bitcoin’s Next Move After $86K: 23% Room to $125K if Supply Wall Breaks
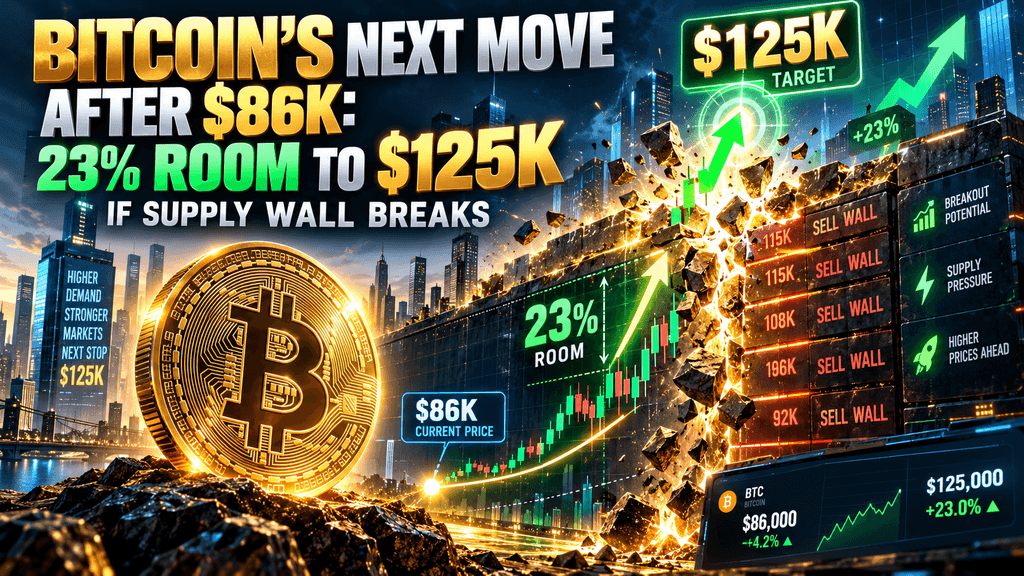
Bitcoin Consolidates as ETF Demand Tests Key $86,000 Resistance
Bitcoin has been navigating late September 2026, consolidating in the low-to-mid $80,000s after a brief surge above $87,000 earlier in the month. The market is currently positioned about 33–34% below its all-time high, reached in October 2025 near $126,000. At the same time, it is trading about 35% above the summer low, which was recorded at around $58,000. Latest on-chain data provided by Glassnode, along with insightful analysis, reveals a concentrated block of more than one million BTC that has been acquired within the price range of $84,000 to $86,000. This accumulation has resulted in the formation of the densest long-term holder cost-basis cluster observed between the cycle low and the previous peak.
In addition, spot Bitcoin ETFs have seen impressive cumulative net inflows, estimated to be in the range of approximately $2.4 billion to $3 billion over recent multi-day streaks. This includes a remarkable single-day peak that approached $999 million, which has played a crucial role in absorbing a portion of the overhead supply that exists in the market. If Bitcoin price can manage to sustain a close above the critical zone of $86,000 to $87,400, while the demand from ETFs remains constructive and supportive, the thin supply overhead presents a measured path of approximately 23% toward the $125,000 region. This scenario would signify a shift in the market dynamics, transitioning from a phase of digestion following the summer recovery into a more pronounced and clearer advance phase, indicating potential bullish momentum ahead.
How the $84K–$86K Long-Term Holder Cluster Became the Immediate Battleground
Glassnode data place the heaviest concentration of long-term holder coins, those held for at least six months, between $84,000 and $85,000, with the broader band from $84,000 to $86,000 containing over one million BTC. Bitfinex analysts note that more than 650,000 BTC sit specifically in the $85,000–$86,500 cost band, the densest node between the $57,803 July low and the $126,110 all-time high. Price action in the final week of September repeatedly tested this zone after the September 21 close near $86,600, the highest daily finish since January.
Capital.com and JPMorgan commentary have flagged the same $84,000–$85,000 area as the first level of interest on any pullback, with production-cost estimates near $85,000 offering a potential floor for miners. Coin-denominated open interest has fallen nearly 20% from August levels to multi-month lows, reducing the risk of cascading liquidations and leaving spot demand as the primary driver. The cluster represents coins accumulated across the prior cycle’s upper range; many of those holders now sit near breakeven or modest profit, raising the probability of distribution if price stalls. Sustained acceptance above the band would convert the wall into support and open the thinner supply region above $86,000.
Why Supply Thins Sharply Once Price Clears $86,000
Bitfinex’s September 27 graphic analysis states that once Bitcoin breaks and holds above $86,000, market supply above that level drops sharply, leaving only approximately 23% upside to the $125,000 area. The same analysis notes that a close above $87,400 accompanied by continued ETF inflows would signal that buyers have absorbed the current selling pressure and that the overhead wall begins to weaken. Realized-price distributions show far fewer coins with cost bases between $87,000 and the prior cycle highs, creating a relative vacuum.
Historical comparisons from earlier recovery phases indicate that such thin zones can produce faster price discovery when demand persists. Short-term holder cost basis has recovered toward the mid-$80,000s, placing a larger share of recent buyers in profit and reducing the urgency of forced selling. The true market mean near $77,000 remains the deeper structural support, while the mean MVRV level near $96,700 forms the next major reference once the immediate cluster is cleared. Traders monitoring current Bitcoin market price levels can observe how quickly volume expands once the densest cost-basis node is left behind.
ETF Inflows as the Primary Absorber of Overhead Supply
U.S. spot Bitcoin ETFs recorded their largest weekly inflow of 2026 at roughly $2.39–$2.4 billion in the week ending September 25, flipping year-to-date flows positive after earlier deficits. BlackRock’s IBIT led with more than $1.2 billion in that week, while Fidelity’s FBTC and other products contributed meaningfully. A seven-to-nine-session streak of consecutive inflows, including a near-$999 million day on September 21, demonstrates persistent institutional demand even as spot price consolidated.
Cumulative net assets across the complex stand near $108 billion, with total net inflows since launch exceeding $57 billion. Glassnode reporting shows 30-day ETF inflows reaching multi-month highs in the preceding period, confirming that regulated vehicles continue to pull coins off the open market. These flows have been sufficient to offset a portion of long-term holder distribution without requiring aggressive leverage. Persistence of positive daily prints into October would reinforce the thesis that the $84,000–$86,000 wall can be worked through rather than becoming a multi-week ceiling.
Open Interest Decline and the Shift Toward Spot-Driven Moves
Coin-denominated open interest has retreated to its lowest reading since March and sits almost 20% below August levels, according to Glassnode. Bitfinex analysts describe perpetual positioning as near neutral after the leverage that accumulated into the $87,000 high was largely cleared. Lower open interest reduces the probability of cascading liquidations on either side and places greater weight on genuine spot buying, particularly from ETFs and corporate treasuries, to determine direction.
Historical recovery phases show that periods of declining leverage often precede more durable advances once key cost-basis levels are reclaimed. The current setup therefore favors measured progress rather than explosive short-covering spikes. Market participants tracking how crypto futures leverage works can see that reduced positioning limits the amplification of any single day’s price move and keeps the focus on the supply-absorption process underway between $84,000 and $86,000.
Seasonal Patterns and the October “Uptober” Context
Bitcoin enters October after a September that delivered a net positive return and a successful reclaim of the $80,000 region from summer lows. Historical seasonal data continue to assign a constructive bias to the fourth quarter, even after the streak of consecutive “Uptober” gains was interrupted in prior cycles. The current price sits well above the true market mean near $77,000 and the 200-week average, preserving a structurally constructive backdrop.
Analysts at Bitfinex have framed the base case as consolidation between the $84,000 long-term holder cluster and the $87,722 yearly open into the monthly and quarterly close. A decisive break of the upper boundary would align with the seasonal window and the thinning supply above $86,000. Volume profiles from the September rebound show accumulation rather than distribution at the lower end of the recent range, supporting the possibility that October can extend the recovery rather than reverse it.
Corporate Treasury and Institutional Accumulation Trends
Public companies and institutional vehicles continue to add Bitcoin even as the price consolidates. Corporate treasury cost bases cluster near $80,500, placing those holders in modest profit at current levels and reducing the likelihood of near-term distribution. Strategy and similar entities have maintained accumulation programs through the summer and early autumn, converting capital-market access into ongoing demand.
ETF data show that the same institutions driving regulated product inflows are also the primary counterparties absorbing coins that long-term holders may elect to sell into strength. The combination of these two demand channels, corporate balance-sheet buying and ETF creations, creates a dual absorption mechanism that was less developed in earlier cycles. Sustained activity from both cohorts would accelerate the conversion of the $84,000–$86,000 wall into a higher base.
MVRV and Realized-Price Roadmap Toward $96K and Beyond
Glassnode and Bitfinex place the mean MVRV price near $96,700 as the first major reference once the immediate supply cluster is cleared. This level represents the realized price multiplied by Bitcoin’s long-run average MVRV ratio and has historically marked intermediate resistance in recovery phases. Short-term holder cost basis near $98,300 forms a related threshold; sustained trading above it would indicate that newer participants remain comfortable holding through volatility.
The path from $86,000 to these levels encounters progressively thinner cost-basis density, consistent with the 23% calculation to the $125,000 region. Realized-price bands for intermediate holder cohorts (18-month to 2-year) sit near $88,000–$90,000, creating a series of stepped targets rather than a single binary barrier. Clearing these successive nodes would confirm that demand is successfully working through the remaining overhead supply.
Technical Structure: Yearly Open and Recent Highs as Confirmation Levels
The $87,722 yearly open remains untested after September highs near $87,300–$87,400. A daily close above this level, accompanied by rising volume and continued ETF inflows, would provide technical confirmation that the supply wall has been absorbed. Daily moving-average stacks remain bullish, with the price above the 20-, 50-, and 200-day exponential averages. Relative-strength readings have cooled from overbought territory into neutral zones, creating room for renewed momentum without immediate exhaustion.
Support is well-defined near the $81,300–$84,000 band; a sustained break below the lower edge would reopen the path toward the True Market Mean near $77,000. The current range therefore functions as a decision zone: resolution higher validates the thin-supply thesis, while resolution lower returns the market to a broader consolidation phase.
Macro Backdrop and Liquidity Conditions Supporting Higher Prices
U.S. Treasury yields and mortgage rates have remained elevated, yet Bitcoin has continued to decouple on a relative basis during the late-September recovery. Liquidity conditions in the broader financial system, including adjustments to bank leverage ratios and Treasury buyback programs, have been cited by market participants as supportive of risk-asset demand.
Standard Chartered research earlier in the year flagged the possibility of a retest of the $126,000 region if momentum and ETF flows persist, later acknowledging upside risk to more conservative year-end targets. Arthur Hayes has separately referenced a $125,000 area as a realistic medium-term objective under expanding U.S. liquidity. These macro and liquidity factors reinforce the on-chain observation that supply above $86,000 is comparatively sparse.
Potential Headwinds That Could Delay Further Gains
A reversal in ETF flows, a sharp rise in long-term holder distribution, or a deterioration in broader risk sentiment could keep the price pinned below the $86,000–$87,400 zone for an extended period. Residual liquidation clusters and order-book sell walls near $85,000 remain visible on short-term heatmaps. Any sustained move back below $84,000 would bring the $77,000 True Market Mean back into focus and challenge the recovery narrative.
Leverage, although reduced, can still re-accumulate quickly; a fresh build-up of open interest without corresponding spot demand would reintroduce fragility. These risks are measurable through daily flow data, on-chain spending metrics, and open-interest trends rather than narrative speculation.
What the Breakout Could Mean for Market Participants
Traders and allocators focused on the $84,000–$86,000 band can track three primary data streams: daily ETF net flows, the rate of long-term holder supply change, and the location of realized-price nodes. A close above $87,400 with positive multi-day ETF prints would constitute the clearest signal that the wall is weakening. Volume confirmation on the break, rather than a low-volume spike, would increase the probability that the thinner supply zone above $86,000 can be traversed.
Position sizing that accounts for the still-elevated realized volatility of the past thirty days remains prudent. Those examining the differences between isolated and cross margin can structure exposure so that any temporary rejection at the cluster does not force premature liquidation.
Past Thin-Supply Rallies After Bitcoin Cost-Basis Barriers
Prior Bitcoin cycles contain multiple examples in which dense cost-basis clusters acted as temporary ceilings before being absorbed by persistent demand, after which price advanced rapidly through thinner regions. The 2023–2024 recovery and earlier post-halving advances both featured multi-week consolidations at major realized-price nodes followed by accelerated moves once those nodes were cleared.
The current 23% calculation from $86,000 to $125,000 is consistent in magnitude with several intermediate legs observed in those earlier periods. The presence of regulated ETF vehicles and corporate treasury demand differentiates the present environment by providing a more continuous absorption mechanism than existed in previous cycles.
Outlook for the Final Quarter of 2026
The combination of a dense but finite supply wall at $84,000–$86,000, thinning overhead above that level, constructive ETF flows, and reduced leverage creates a clearly defined conditional path. Sustained acceptance above $86,000–$87,400 would open the measured 23% room toward the $125,000 region identified by Bitfinex analysis. Failure to clear the cluster would leave the market in a broader range between the true market mean near $77,000 and the yearly open near $87,700.
October’s seasonal window and the ongoing institutional absorption process will determine which scenario materializes. Market participants who continue to monitor on-chain cost-basis distributions, daily ETF prints, and open-interest trends will be best positioned to assess whether the supply wall ultimately yields.
🔥 Beyond the Headlines: What KuCoin 5.0 Means for You
Market news moves fast — but where you act on it matters just as much. This October, KuCoin launches KuCoin 5.0, transforming KuCoin into a rebuilt platform. Here's what actually changes for you:
-
One account for everything. Older platforms split your money across separate "spot," "margin," and "futures" accounts and expected you to understand why. KuCoin 5.0's unified account removes that entirely — deposit once, and everything is simply there (only available to VIPs for now).
-
Stocks, indices, and commodities. KuCoin 5.0 expands beyond crypto into global markets. When crypto chops sideways and equities rally (or the reverse), you rotate in minutes instead of opening a brokerage account and waiting days for fiat rails.
-
Real-world assets (RWA). Tokenized exposure to traditional assets like commodities, right inside your crypto account. One of the fastest-growing segments in global finance is no longer reserved for institutions — you access it from the same balance you trade with.
-
Earn while you learn. Not ready to trade? KCUSD lets your stablecoins earn daily, auto-compounding interest. The lowest-stress way to put your idle deposit to work for 4% yield.
-
An AI assistant in plain language. Ask questions, get market context, understand what you're looking at — built into the platform, no jargon required.
-
An app that doesn't overwhelm. Faster, cleaner, and consistent — intuitive from the first tap, not after a tutorial.
-
Safety you can check, not just trust. A MiCAR-licensed EU entity, Proof of Reserves you can verify yourself, and internationally certified security (SOC 2 Type II, ISO 27001:2022).
Create your account in minutes — and start on the platform built for where crypto is going, not where it's been.
FAQs
What exactly constitutes the supply wall at $84,000–$86,000?
The wall consists of more than one million BTC whose last on-chain movement occurred in that price range, predominantly held by long-term wallets that have not spent the coins for at least six months. Glassnode cost-basis heatmaps show the densest concentration near $84,000–$85,000, with an additional large block extending to $86,500. These holders sit near breakeven or modest profit at current prices, creating a natural zone of potential distribution if prices stall. Absorption of this block by ETF and corporate demand would convert the resistance into support.
How is the 23% upside to $125,000 calculated?
Bitfinex analysis measures the percentage distance from a sustained break above $86,000 to the $125,000 region, which sits just below the October 2025 all-time high near $126,000. The figure reflects the relative scarcity of coins with cost bases between those two levels. It is a structural observation rather than a price target or guarantee; realization depends on continued demand that successfully works through the remaining supply.
Have ETF inflows been large enough to absorb the wall?
Recent weekly inflows of approximately $2.4 billion and a multi-session streak totaling near $3 billion demonstrate meaningful absorption capacity. BlackRock’s IBIT and other large products have led the buying. Whether the pace continues into October will determine if the full one-million-plus BTC cluster can be cleared without a prolonged consolidation.
What happens if Bitcoin closes below $84,000?
A sustained break below the lower edge of the long-term holder cluster would reopen the path toward the True Market Mean near $77,000 and challenge the recovery narrative that began from the summer lows. Support levels and on-chain metrics would then be reassessed for evidence of renewed distribution or accumulation.
Is reduced open interest a bullish or neutral signal?
Lower coin-denominated open interest reduces the risk of cascading liquidations and shifts the burden of price discovery onto spot demand. In the current context, it is constructive because it leaves ETF and corporate flows as the primary drivers rather than leveraged positioning.
Disclaimer: This content is for informational purposes only and does not constitute investment advice. Cryptocurrency investments carry risk. Please do your own research (DYOR).