

10-Year Treasury Tops 5% as S&P 500 Earnings Yield Falls Behind
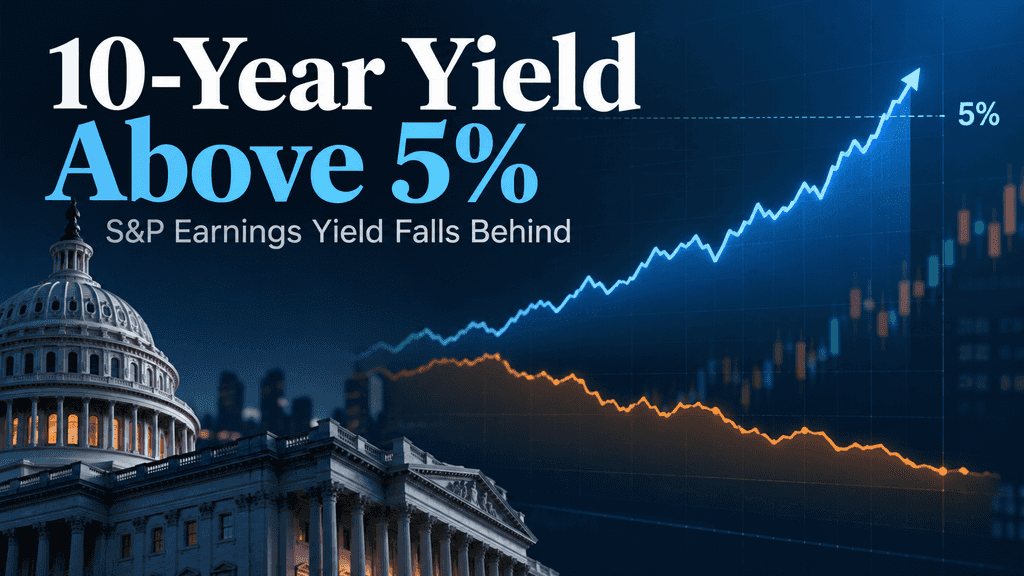
The 10-year U.S. Treasury yield has climbed above 5%, reaching levels not seen since 2007 and reshaping the valuation debate between government bonds and U.S. equities. On September 29, 2026, the official 10-year Treasury yield stood at 5.26% after reaching an intraday high of 5.29%. At the same time, the S&P 500's trailing earnings yield was around 3.8%, giving Treasuries an unusually large yield advantage on that measure.
The gap reflects more than a simple stocks-versus-bonds comparison. Persistent inflation, changing Federal Reserve expectations, resilient U.S. growth and pressure in the long-term bond market have pushed Treasury yields higher, while elevated S&P 500 valuations have kept the trailing earnings yield relatively low. However, forward earnings tell a less extreme story, making the distinction between historical and expected profits important for understanding what the current Treasury-S&P 500 yield gap actually means for markets.
Why the 10-Year Treasury Yield Rose Above 5%
The 10-year Treasury yield moved above 5% in September 2026, reaching as high as 5.29% on September 29, its highest level since 2007. The rise reflected a broad repricing across the bond market rather than a single data release. Investors were responding to persistent inflation, firmer economic growth and expectations that U.S. interest rates could remain elevated for longer than previously expected. Higher long-term yields also suggest that bond investors are demanding more compensation for inflation and interest-rate uncertainty.
Inflation remained an important part of that shift. U.S. headline CPI rose 3.4% year over year in August, while the Federal Reserve raised its target range by 25 basis points to 3.75% -- 4.00% on September 16. Strong business investment also reduced the case for rapid rate cuts, with core capital-goods orders increasing 1.6% month over month and 10.6% from a year earlier in August. Together, those signals suggested that the economy was still strong enough to tolerate tighter financial conditions, a backdrop also shaping the broader debate around the Fed rate hike and financial markets. If growth remains firm while inflation stays above target, investors may continue to price a higher path for interest rates.
Oil Prices and Treasury Supply Added More Pressure
Higher oil prices added to concerns that inflation could remain sticky, while heavy U.S. government borrowing increased the amount of Treasury debt investors had to absorb. When bond supply rises while investors demand greater compensation for inflation and interest-rate risk, prices can fall and yields move higher. These forces helped push the 10-year Treasury yield above 5%, making government bonds more competitive with equities and widening the gap with the S&P 500's roughly 3.8% trailing earnings yield.
Another factor to watch is the Treasury term premium, or the extra compensation investors demand for holding longer-dated government debt. A rising term premium can keep the 10-year yield elevated even when expectations for short-term Fed rates are relatively stable. Treasury auction demand, foreign purchases and institutional appetite for long-duration bonds can therefore become important signals for whether yields remain above 5% or begin to retreat.
How the 10-Year Treasury Yield Compares With the S&P 500 Earnings Yield
The gap between the 10-year Treasury yield and the S&P 500 earnings yield has become unusually wide. On September 29, 2026, the official 10-year Treasury yield stood at 5.26%, while the S&P 500's trailing earnings yield was about 3.82%. That leaves a difference of roughly 1.44 percentage points, or 144 basis points, in favor of Treasuries when using trailing earnings. The comparison has become more relevant because both measures are widely used when investors assess whether equity valuations still compensate for additional market risk.
The comparison can be understood through four key numbers:
-
10-year Treasury yield: 5.26% — the yield on benchmark U.S. government debt.
-
S&P 500 trailing earnings yield: about 3.82% — based on earnings generated over the previous 12 months relative to the index price.
-
Treasury yield advantage: about 1.44 percentage points, or 144 basis points — the difference between the 10-year Treasury yield and the S&P 500 trailing earnings yield.
-
S&P 500 dividend yield: about 1.06% — the cash dividend return relative to the index price, which should not be confused with earnings yield.
Trailing Earnings Show a Historically Wide Stock-Bond Yield Gap
The S&P 500 earnings yield is essentially the inverse of its price-to-earnings ratio. With the index trading near 26 times trailing earnings, every $100 invested in the index corresponds to roughly $3.80 of annual corporate earnings based on the previous 12 months. By comparison, the 10-year Treasury was yielding more than $5.20 per $100 of principal at current rates. This helps explain why the Treasury vs. S&P 500 yield spread has attracted so much attention: government bonds now offer a noticeably higher nominal yield than the index's trailing earnings yield, even before considering differences in risk.
This comparison also changes the relative attractiveness of equity valuations. When the S&P 500 earnings yield falls below the 10-year Treasury yield, investors may demand stronger profit growth before accepting high stock-market multiples. That does not automatically trigger selling, but it can make earnings revisions, profit margins and free-cash-flow growth more important in determining which companies can continue to justify premium valuations.
Forward Earnings Make the Comparison Much Closer
The picture changes when expected profits are used instead of historical earnings. The S&P 500 has recently traded near 19 times forward earnings, implying a forward earnings yield of roughly 5.3%. That puts the index much closer to the 10-year Treasury yield than the trailing comparison suggests. Investors typically value stocks partly on future earnings growth, so this distinction matters. If corporate earnings continue expanding, equities can remain competitive despite high bond yields. If earnings expectations weaken while Treasury yields stay above 5%, pressure on stock valuations could increase.
Forward earnings estimates also introduce an important source of uncertainty because they depend on analysts' expectations rather than completed results. If companies consistently beat forecasts or raise guidance, the implied forward earnings yield can remain competitive with Treasury bonds. If estimates are revised lower, however, that apparent valuation support can fade quickly, making S&P 500 earnings revisions an important indicator to track alongside bond yields.
The key point is that the current numbers do not simply prove that bonds now “beat” stocks. They show that Treasuries have a clear advantage over the S&P 500 on a trailing earnings basis, while the forward earnings comparison is much closer to parity. That difference is central to understanding what the current stock-bond yield gap actually says about U.S. equity valuations.
Is the Treasury-S&P 500 Yield Gap Really at a 25-Year Extreme?
The Treasury-S&P 500 yield gap is near a roughly 25-year extreme on a trailing earnings basis, but the wording matters. The crossover itself did not first happen in September 2026. Research published in 2025 had already noted that the S&P 500's trailing earnings yield had fallen below the 10-year Treasury yield for the first time in almost 25 years. What is more unusual now is the size of the gap. With the 10-year Treasury above 5.2% and the S&P 500 trailing earnings yield near 3.8%, the spread has moved much further in favor of government bonds than it was when the relationship first flipped.
That makes the current setup historically notable without implying that September 2026 marks the first crossover in 25 years. The stronger comparison is that Treasuries now offer one of their largest yield advantages over the S&P 500's trailing earnings yield since the early 2000s. The historical context also shows why the gap should not be treated as a standalone market signal. Stock valuations still depend on future earnings growth, profit margins and investor expectations, while Treasury yields reflect inflation, interest rates and demand for government debt. The 25-year comparison therefore highlights an unusual valuation relationship, not a guarantee about which asset will perform better next. It is most useful as one valuation signal alongside earnings growth, credit conditions and real interest rates.
What 5% Treasury Yields Mean for S&P 500 Valuations and Investors
A 10-year Treasury yield above 5% changes the valuation backdrop for the S&P 500 because investors can earn a relatively high return from government bonds without taking the same level of equity-market risk. That raises the hurdle stocks must clear. Companies need stronger earnings growth, better cash flow or more attractive valuations to justify premium prices when bonds are offering yields that were unavailable for much of the post-2008 period. Similar yield pressures can also affect risk appetite across broader crypto markets, where liquidity and interest-rate expectations often influence asset pricing.
Higher Discount Rates Put Pressure on Expensive Stocks
Treasury yields also feed into the discount rates used to value future corporate profits. When those rates rise, earnings expected many years from now are worth less in present-value terms. This can weigh more heavily on companies trading at high price-to-earnings multiples, particularly growth stocks whose valuations depend heavily on future profits. The effect is not automatic, however. Strong earnings growth can offset part of the valuation pressure, which helps explain why the S&P 500 can remain resilient even when long-term bond yields rise sharply.
Higher long-term rates can also increase the cost of financing for companies through more expensive corporate debt and refinancing. Businesses with large borrowing needs or weaker balance sheets may face greater pressure as older low-cost debt matures. This means a sustained 5% Treasury yield environment can affect stock valuations through both higher discount rates and higher corporate funding costs, especially if borrowing conditions tighten across credit markets.
The Impact Is Different Across S&P 500 Sectors
A 5% Treasury yield does not affect every part of the stock market in the same way. Long-duration growth companies are generally more sensitive to rising discount rates, while banks, insurers and other financial businesses can respond differently depending on the shape of the yield curve and credit conditions. Dividend-heavy sectors also face more direct competition from bonds because investors comparing income opportunities can now earn higher yields from government debt without relying on corporate dividends.
Sector balance sheets also matter. Companies with large cash positions and limited refinancing needs may be better placed to absorb a prolonged period of high rates, while heavily indebted businesses can face a more difficult earnings outlook. As a result, a high-yield environment can widen performance differences within the S&P 500 rather than affecting every company equally.
Earnings Growth Becomes More Important When Bond Yields Stay High
For investors, the main issue is therefore not whether the 10-year Treasury crosses one specific level, but whether corporate earnings can grow fast enough to compensate for higher interest rates and tighter valuation conditions. If profit expectations remain strong, elevated Treasury yields can coexist with rising stock prices. If earnings forecasts weaken while long-term yields stay near or above 5%, the market may have less room to support high valuation multiples. That makes upcoming earnings reports, inflation data and Federal Reserve policy especially important for the next phase of the S&P 500 valuation debate.
The quality of earnings could become just as important as headline growth. Investors may pay closer attention to margins, free cash flow and guidance rather than relying only on revenue growth, particularly if financing costs remain elevated. A market supported by improving profits can handle higher yields more easily than one driven mainly by expanding valuation multiples.
What Could Move Treasury Yields and Stocks Next: PCE, Jobs, CPI and the Fed
With long-term yields already above 5%, the next direction for Treasury yields and the S&P 500 will depend heavily on whether incoming economic data supports further Federal Reserve tightening or gives policymakers room to ease. The key question is no longer simply whether rates are high, but whether inflation and economic growth remain strong enough to keep them there. Markets are likely to react most strongly to data that materially changes expectations for the path of Fed policy.
PCE Inflation
The August PCE inflation report, due September 30, will provide the Fed's preferred measure of price pressures. A hotter-than-expected reading could reinforce expectations that monetary policy will stay restrictive and put renewed upward pressure on Treasury yields. Softer inflation would reduce some of that pressure, particularly if underlying core PCE also shows improvement.
Investors will also look beneath the headline number for signs of whether services inflation and other persistent categories are cooling. A sustained improvement in underlying inflation would make it easier for markets to price a less restrictive policy path, while another upside surprise could keep long-term yields elevated.
Jobs Report
The September U.S. employment report on October 2 will show whether the labor market is still absorbing higher borrowing costs. Strong payroll growth and firm wage gains could support the case for keeping interest rates elevated, while weaker hiring or rising unemployment would point toward slower economic momentum. For stocks, the market reaction may depend on whether softer labor data is viewed as healthy cooling or a warning that earnings growth could weaken.
Average hourly earnings and the unemployment rate may be just as important as the headline payroll number. Persistent wage pressure can complicate the inflation outlook, while a sudden deterioration in hiring could shift investor attention from inflation risk toward recession and corporate-profit risk.
CPI Data
September Consumer Price Index data, scheduled for October 14, will provide another test of whether recent energy-price pressure is spreading into broader inflation. Investors will pay particular attention to core inflation because persistent price growth in services or housing could make it harder for the Fed to shift toward lower rates. Treasury markets can react sharply when CPI readings change expectations for the future policy path.
The composition of inflation will matter as much as the headline rate. If energy costs rise while core categories cool, markets may treat the increase differently from a broad acceleration in prices. A more persistent rise across housing and services would create a tougher backdrop for both bonds and high-valuation stocks.
Fed Decision
The next Federal Reserve meeting on October 27–28 brings these signals together. Markets will be watching not only the rate decision but also the Fed's language on inflation, economic growth and the possibility of additional tightening. The debate over whether the Fed could keep rates higher or tighten further is also reflected in the broader 2026 Federal Reserve interest-rate outlook. For the S&P 500, a move toward lower yields could ease pressure on valuation multiples, while another sustained rise in long-term rates would keep the focus on whether corporate earnings can justify current stock prices. Until then, each major inflation and employment release has the potential to reset expectations across both the bond and equity markets.
The Fed's guidance may matter almost as much as the actual policy decision. Investors will be looking for clues about how policymakers balance persistent inflation against any emerging weakness in employment or growth. That communication can quickly influence Treasury yields, financial conditions and expectations for future corporate earnings.
-
One account for everything. Older platforms split your money across separate "spot," "margin," and "futures" accounts and expected you to understand why. KuCoin 5.0's unified account removes that entirely — deposit once, and everything is simply there (only available to VIPs for now).
-
Stocks, indices, and commodities. KuCoin 5.0 expands beyond crypto into global markets. When crypto chops sideways and equities rally (or the reverse), you rotate in minutes instead of opening a brokerage account and waiting days for fiat rails.
-
Real-world assets (RWA). Tokenized exposure to traditional assets like commodities, right inside your crypto account. One of the fastest-growing segments in global finance is no longer reserved for institutions — you access it from the same balance you trade with.
-
Earn while you learn. Not ready to trade? KCUSD lets your stablecoins earn daily, auto-compounding interest. The lowest-stress way to put your idle deposit to work for 4% yield.
-
An AI assistant in plain language. Ask questions, get market context, understand what you're looking at — built into the platform, no jargon required.
-
An app that doesn't overwhelm. Faster, cleaner, and consistent — intuitive from the first tap, not after a tutorial.
-
Safety you can check, not just trust. A MiCAR-licensed EU entity, Proof of Reserves you can verify yourself, and internationally certified security (SOC 2 Type II, ISO 27001:2022).
Conclusion
The rise of the 10-year Treasury yield above 5% has created one of the most unusual stock-bond valuation setups in decades. On a trailing earnings basis, Treasuries now offer a substantial yield advantage over the S&P 500, while the gap becomes much narrower when forward earnings expectations are used. That distinction is important because today's market cannot be understood from one valuation measure alone.
What happens next will depend on whether inflation cools, economic growth slows and corporate earnings remain strong enough to justify current equity valuations. PCE inflation, employment data, CPI and the Federal Reserve's October meeting will help determine whether long-term Treasury yields stay above 5%, move even higher or begin to retreat. For investors, the central question is not simply whether bonds currently yield more than stocks, but whether future earnings growth can continue to offset a much higher cost of capital.
FAQs
1. What is considered a high 10-year Treasury yield?
There is no fixed level that is always considered high because the answer depends on inflation, Federal Reserve policy and economic growth. A yield above 5% is high compared with much of the post-2008 period and materially changes how investors compare bonds with equities.
2. Why do Treasury yields rise when bond prices fall?
Bond prices and yields move in opposite directions. When investors sell existing Treasuries, their market prices fall. Because the coupon payment is fixed, the effective yield available to a new buyer rises until the bond becomes competitive with current market rates.
3. Is the S&P 500 earnings yield the same as its dividend yield?
No. The earnings yield measures company profits relative to the index price, while the dividend yield measures only cash dividends paid to shareholders. A company may retain a large share of its earnings rather than distribute them as dividends.
4. How is the S&P 500 earnings yield calculated?
The earnings yield is the inverse of the price-to-earnings ratio. For example, an index trading at 25 times earnings has an earnings yield of about 4%, calculated as 1 divided by 25.
5. Why does the forward earnings yield differ from the trailing earnings yield?
Trailing earnings use profits already reported over the previous 12 months. Forward earnings rely on analyst estimates for future profits. If earnings are expected to grow quickly, the forward earnings yield can be noticeably higher than the trailing figure.
6. What is the equity risk premium?
The equity risk premium is the additional return investors expect for holding stocks instead of lower-risk assets such as government bonds. There are several ways to calculate it, so comparisons should state whether they use trailing earnings, forward earnings, nominal Treasury yields or real bond yields.
Disclaimer
This article is for informational and educational purposes only and does not constitute financial or investment advice. Market conditions can change rapidly, and readers should conduct their own research and consider their financial situation and risk tolerance before making investment decisions.