

Bitcoin Price Prediction: Can BTC Hold $80K After August CPI?

Bitcoin had a rough week.
On September 11, the U.S. Bureau of Labor Statistics released its August inflation report. Headline inflation came in close to what economists expected, but core inflation was a little firmer than anticipated, keeping investors cautious about how quickly the Federal Reserve can ease monetary policy.
Bitcoin didn't take the numbers lightly. BTC dropped shortly after the report, then reversed higher and climbed back toward $80,000, a level it has struggled to hold in recent weeks.
But the price swings are telling a bigger story. Bitcoin still has strong buyers behind it, including demand flowing through spot ETFs, yet short-term selling pressure has kept the market from turning that demand into a sustained move higher. With the Fed's next decision approaching, the question is whether buyers can absorb that pressure and keep $80,000 within reach.
How Did Bitcoin React to the August CPI Report?
Bitcoin dropped, then recovered, all within hours of the August CPI release. The move wasn't random. It came from a report that looked calm on the surface but carried a mixed signal underneath, and Bitcoin's price traced that mix almost exactly.
What Did the August CPI Data Actually Show?
The headline numbers were relatively unremarkable. Consumer prices rose 3.4% over the past year and 0.4% from July, broadly in line with economists' expectations. On the surface, the report offered little reason for a major shift in the inflation outlook.
Core inflation told a more mixed story. The annual core rate, which excludes food and energy, eased from 2.5% in July to 2.4% in August. That suggested underlying inflation was still moving lower, even if the pace remained above the Federal Reserve's 2% target.
The monthly core figure pointed in the other direction. Core prices rose 0.3% in August, ahead of the 0.2% economists had expected. That one-tenth difference mattered because it suggested that while disinflation was continuing, underlying price pressures had not disappeared, giving markets another reason to question how quickly the Federal Reserve can ease monetary policy.
Why Did Bitcoin Dip Then Recover on CPI Day?
Bitcoin was already trading near $76,500 when the report landed. In the minutes after the release, it slipped toward $76,000 as investors reacted to the firmer-than-expected monthly core inflation reading.
The move did not last. Bitcoin reversed higher and climbed toward $79,000, bringing $80,000 back into view before giving up some of those gains.
The recovery also came as Bitcoin's technical picture was improving. The cryptocurrency had recently formed a golden cross, with its 50-day moving average moving above its 200-day average, a technical signal that traders often interpret as a sign of improving medium-term momentum.
The mixed CPI figures help explain why Bitcoin's reaction was so volatile. The 2.4% annual core reading showed that underlying inflation was still easing, while the stronger-than-expected 0.3% monthly reading suggested that progress remained uneven. That left traders balancing the possibility of continued disinflation against concerns that inflation could prove sticky enough to keep the Federal Reserve cautious.
Why Are Bitcoin ETF Flows Sending Mixed Signals?
Bitcoin's ETF flows tell two different stories depending on the timeframe. Zoom out to the month and the picture is one of returning institutional demand. Zoom in to the days right before CPI and that demand appears to have weakened. Both are true, and understanding why matters more than picking one.
How Strong Was August's Bitcoin ETF Inflow?
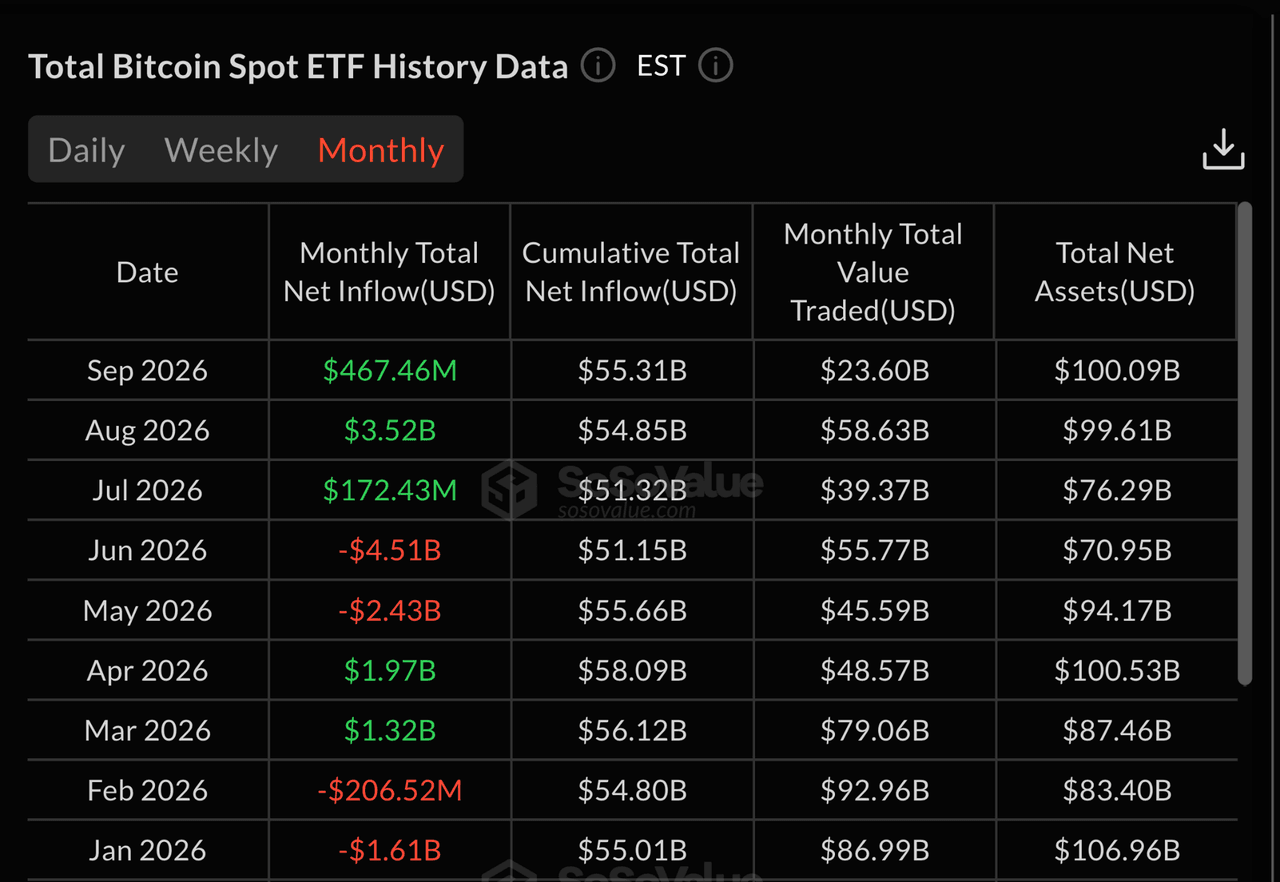
US spot Bitcoin ETFs pulled in about $3.52 billion in net inflows during August, according to SoSoValue. That's the strongest month of 2026 for the funds, up from just $172 million in July.
(Image source: SoSoValue)
The buying was also consistent. ETFs recorded net inflows on 16 of August's 21 trading sessions, including a nine-session run from August 17 to August 27. The data pointed to sustained demand rather than a single burst of buying.
Most of that demand ran through one fund. BlackRock's IBIT was the largest single driver on several of August's strongest days, capturing as much as 76% of net flow on August 18 and roughly 62% on another strong session later in the month. Total assets across all US spot Bitcoin ETFs climbed from about $76 billion at the end of July to roughly $100 billion by the end of August.
That's a meaningful jump in scale, but it also means the recovery in demand has been narrower than the headline monthly number suggests, concentrated in the largest player rather than spread evenly across the market.
Why Did Flows Turn Negative Right Before CPI?
That momentum changed in September. Across the four trading sessions from September 8 to September 11, US spot Bitcoin ETFs recorded a combined $462.7 million in net outflows, with every session posting a loss. The week had four sessions instead of five because US markets were closed for Labor Day on September 7.
The two aren't contradictory. Demand can stay strong over a month while turning cautious over a few days, and that's what happened here. August showed sustained buying. The days leading into CPI showed some of that buying pulling back.
For Bitcoin, that distinction matters. Strong monthly ETF inflows are a real source of demand, but they haven't been enough on their own to keep BTC above $80,000.
Will a Fed Rate Hike Keep Bitcoin Below $80,000?
The Federal Reserve's two-day policy meeting runs September 15 and 16, with a rate decision due at the end of the second day. For the first time since 2023, markets are pricing in a real chance the Fed raises rates rather than holding steady or cutting.
That shift didn't happen gradually. It accelerated sharply after the August CPI report was released on September 11, and it's now sitting at the center of why Bitcoin can't seem to hold $80,000.
How High Are the Odds of a Fed Rate Hike in September 2026?
The CPI report covered earlier wasn't an isolated data point. It was the latest in a run of numbers that pushed the Fed toward its most hawkish stance in years.
Odds of a hike sat closer to 30 to 44% in late August. They jumped to around 66% after Fed Chair Kevin Warsh's Jackson Hole speech, then climbed further once the August CPI report landed, reaching as high as 87% on CME FedWatch and 83% on Polymarket by mid-September.
At the Fed's July meeting, policymakers held rates steady at 3.50% to 3.75%, but three members already dissented in favor of a hike, a sign the committee was leaning hawkish before the CPI data even arrived.
That combination, a hawkish Fed and a market almost fully pricing in a hike, is exactly the backdrop Bitcoin is trying to hold $80,000 against.
How Would a Fed Rate Hike Affect Bitcoin's Price?
A Fed rate hike would tighten financial conditions at a time when Bitcoin is already struggling to clear $80,000. Higher rates can make interest-bearing assets such as Treasuries more attractive relative to non-yielding assets like Bitcoin. That pressure is already visible in the bond market, with the 10-year Treasury yield rising above 5% on September 15 as expectations for a Fed hike strengthened.
But the hike itself may not be the biggest risk for Bitcoin. Markets have been preparing for it, with economists and traders assigning a high probability to a 25-basis-point increase at the September meeting.
The bigger question is what comes next. If the Fed signals that further rate increases may be needed to contain inflation, the market could reprice the path of monetary policy and put additional pressure on risk assets. A hike accompanied by more hawkish guidance would therefore be more significant for Bitcoin than a widely expected 25-basis-point increase on its own.
That does not guarantee a move in either direction. But with Bitcoin trading around $77,000 and still below $80,000, a hawkish Fed outcome could make it harder for buyers to push the price through that resistance.
Bitcoin Price Prediction: What Happens if BTC Breaks $80K?
Everything covered so far, the CPI report, ETF flows, the Fed's rate decision, points toward the same unresolved question. Analysts are split on which way Bitcoin moves from here, and the data supports scenarios in both directions rather than a single confident call. Here's what each side of that split is actually watching.
What Could Push Bitcoin Above $80K?
A break above $80,000 would most likely need ETF demand to return in force. Spot Bitcoin ETFs logged three consecutive weeks of inflows before turning negative heading into CPI week, and a resumption of that buying is the clearest path back toward the highs.
Continued disinflation would help too. If upcoming inflation data extends the cooling trend seen in the annual core CPI figure, it would ease pressure on the Fed and reduce the case for further tightening beyond September.
There's also a case built around the rate decision itself. Since hike odds climbed above 80% well before the meeting, much of that outcome may already be priced into Bitcoin's current range. A hike that arrives without a more hawkish tone attached, no signal of additional increases ahead, could trigger the kind of relief move where an expected outcome ends up being less damaging than the anticipation around it.
Technically, bulls need Bitcoin to keep defending the $76,000 to $78,000 zone that has held as support through most of September. Analyst Moreno, cited by Parameter, sees the 200-day moving average near $70,000 as the nearest major support beneath that, with an $83,000 target still viable if it holds. Other technical reads put support closer to $75,900, with a daily close above $82,000 seen as the trigger for a run toward $85,000.
What Could Send Bitcoin Below $76K?
The downside case largely mirrors the upside one in reverse. Renewed ETF outflows, a continuation of the pattern seen in the days before CPI, would remove a source of demand that's been doing much of the work keeping Bitcoin's range intact.
A more hawkish Fed than markets expect is the bigger risk. If the Fed hikes and pairs it with a dot plot signaling further increases, that combination hasn't been priced in the way a standalone hike has, and it's the scenario analysts flag most often as capable of breaking the current range to the downside.
Treasury yields staying elevated, particularly if the 10 year holds above 5%, would reinforce that pressure by keeping safer assets competitive with Bitcoin for investor demand.
Inflation risk hasn't fully gone away either. Rising oil prices tied to the ongoing conflict between the US and Iran remain a wildcard that could feed back into future CPI readings. If short-term selling pressure builds on top of any of these triggers, some analysts see Bitcoin's next real support test lower, with one recent technical scenario pointing toward the $75,200 to $76,700 area if the $77,500 zone fails to hold on rising volume.
What Are the Key Bitcoin Price Levels to Watch?
-
$76,000 to $78,000: the near-term support zone buyers have defended through most of September
-
$80,000: the major psychological and technical resistance level Bitcoin has repeatedly failed to clear
-
$82,000: the September high, reached briefly on September 3, and the next upside target if $80,000 breaks with momentum
None of this is a guaranteed outcome. It's a map of the conditions analysts are watching, and which combination shows up first, stronger ETF demand or a more hawkish Fed, will likely decide which side of $80,000 Bitcoin settles on next.
Conclusion
Bitcoin's struggle to hold $80,000 isn't about one report or one headline. It's the result of several forces pulling against each other at the same time.
The August CPI report gave both sides something to work with, a cooling annual core rate and a hotter monthly reading. ETF demand told a similar split story, strong across August, weaker in the days right before CPI. Now a Fed decision carrying real hike odds adds another layer of uncertainty on top of both.
None of these forces settle the question on their own. Together, they explain why Bitcoin keeps testing $80,000 without clearing it, and why the next move likely depends on which pressure wins out first, renewed ETF buying or a Fed that turns out more hawkish than priced in.
For now, $76,000 to $78,000 remains the level buyers are defending, and $80,000 remains the level sellers keep defending right back. Which side breaks first is still an open question, not a settled one.
🔥 Beyond the Headlines: What KuCoin 5.0 Means for You
Market news moves fast — but where you act on it matters just as much. This October, KuCoin launches KuCoin 5.0, transforming KuCoin into a rebuilt platform. Here's what actually changes for you:
-
One account for everything. Older platforms split your money across separate "spot," "margin," and "futures" accounts and expected you to understand why. KuCoin 5.0's unified account removes that entirely — deposit once, and everything is simply there.
-
Stocks, indices, and commodities. KuCoin 5.0 expands beyond crypto into global markets. When crypto chops sideways and equities rally (or the reverse), you rotate in minutes instead of opening a brokerage account and waiting days for fiat rails.
-
Real-world assets (RWA). Tokenized exposure to traditional assets like commodities, right inside your crypto account. One of the fastest-growing segments in global finance is no longer reserved for institutions — you access it from the same balance you trade with.
-
Earn while you learn. Not ready to trade? KCUSD lets your stablecoins earn daily, auto-compounding interest. The lowest-stress way to put your idle deposit to work for 4% yield.
-
An AI assistant in plain language. Ask questions, get market context, understand what you're looking at — built into the platform, no jargon required.
-
An app that doesn't overwhelm. Faster, cleaner, and consistent — intuitive from the first tap, not after a tutorial.
-
Safety you can check, not just trust. A MiCAR-licensed EU entity, Proof of Reserves you can verify yourself, and internationally certified security (SOC 2 Type II, ISO 27001:2022).
Create your account in minutes — and start on the platform built for where crypto is going, not where it's been.
FAQs
Can Bitcoin hold $80,000 after the August CPI report?
Bitcoin can hold $80,000 if ETF demand strengthens and the Federal Reserve avoids a more hawkish policy outlook. Stronger selling pressure or higher yields could push BTC lower.
What did the August 2026 CPI report mean for Bitcoin?
August CPI showed inflation rising 3.4% annually, while core inflation eased to 2.4%. The mixed data increased uncertainty around the Fed's rate path and Bitcoin's outlook.
Will a Fed rate hike push Bitcoin below $80,000?
A Fed hike could pressure Bitcoin if accompanied by guidance for further increases. However, a widely expected hike may have limited impact if markets have already priced it in.
What are the key Bitcoin price levels to watch?
The $76,000 to $78,000 zone is the key near-term support, while $80,000 remains major resistance. A sustained break above $80,000 could bring $82,000 into focus.
Are Bitcoin ETF inflows still supporting BTC?
Yes. US spot Bitcoin ETFs recorded about $3.52 billion in net inflows during August, although September outflows show that institutional demand has weakened in the short term.
Disclaimer
The information provided on this page may originate from third-party sources and does not necessarily represent the views or opinions of KuCoin. This content is intended solely for general informational purposes and should not be considered financial, investment, or professional advice. KuCoin does not guarantee the accuracy, completeness, or reliability of the information, and is not responsible for any errors, omissions, or outcomes resulting from its use. Investing in digital assets carries inherent risks. Please carefully evaluate your risk tolerance and financial situation before making any investment decisions. For further details, please consult KuCoin’s Terms of Use and Risk Disclosure.