

US Trade Deficit Hits $105.6B in August, Highest Since March 2025
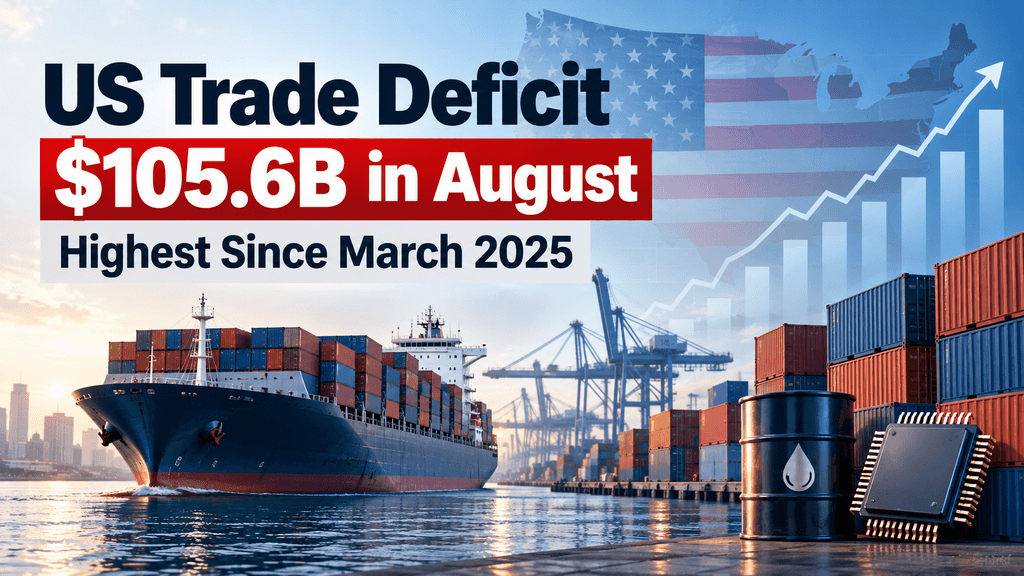
US Trade Deficit Jumps 13.7% to $105.6 Billion in August 2026
The US trade deficit widened by 13.7% to $105.6 billion in August 2026, its highest level since March 2025, as imports grew significantly faster than exports. According to the US Bureau of Economic Analysis (BEA), the goods and services deficit increased by $12.7 billion from a revised $92.8 billion in July. Total imports climbed 4.3% to a record $420.8 billion, an increase of $17.2 billion, while exports rose just 1.4% to $315.2 billion. The October 6 report showed that the trade gap exceeded economists' expectations of approximately $102 billion, reflecting continued demand for imported goods despite higher trade barriers.
The widening gap was concentrated in merchandise trade, where the goods deficit increased by $12.8 billion to $136.6 billion. Meanwhile, the US maintained a services trade surplus of approximately $31 billion, partially offsetting the imbalance in physical goods. Although August recorded the largest monthly shortfall in 17 months, the broader picture was less negative. The cumulative US trade deficit for the first eight months of 2026 remained $138.2 billion, or 19.9%, below the same period in 2025. A sharp monthly increase does not necessarily indicate a sustained deterioration in the country's external trade position. The figures show how changing import demand and uneven trade flows can produce substantial monthly swings even when the year-to-date balance has improved.
Record US Imports: Oil, Gold, Semiconductors, and AI Infrastructure Drive Trade Growth
The surge in US imports during August 2026 was largely driven by stronger demand for industrial supplies, energy products, and capital equipment. Data from the US Bureau of Economic Analysis (BEA) showed that goods imports increased by $17.2 billion to $342.2 billion, with industrial supplies and capital goods accounting for most of the growth. Higher purchases of crude oil, nonmonetary gold, semiconductors, and industrial machinery contributed to the increase. The composition of imports also points to continued business investment, particularly in technology infrastructure and equipment used across major industries.
Oil and Gold Imports Lead Industrial Supplies Growth
Imports of industrial supplies and materials increased by $9.1 billion in August 2026, including a $3.3 billion rise in crude oil and a $3.1 billion increase in nonmonetary gold. These two categories contributed significantly to the growth in US merchandise imports, reflecting higher spending on energy resources and precious metals. Crude oil remains an important input for American refineries and industrial operations, while gold trade can fluctuate with changes in market prices, investment activity, and international shipments.
However, higher import values do not necessarily indicate an equivalent increase in the physical volume of goods entering the country. Changes in global oil prices and gold valuations can influence monthly trade figures, making it important to distinguish spending from actual import quantities. Nonmonetary gold also receives special treatment in US national economic accounts, so its contribution to the reported trade deficit does not translate directly into the same effect on gross domestic product (GDP). This distinction matters when assessing whether rising import costs reflect stronger domestic demand or changes in commodity prices.
Semiconductor and Machinery Imports Support Capital Investment
US capital goods imports increased by $6.2 billion, including a $2.4 billion rise in semiconductors and a $1.3 billion increase in other industrial machinery. Total capital goods imports reached a record $146.4 billion, reflecting substantial demand for foreign-made equipment used in manufacturing, computing, and business expansion. These purchases differ from consumer imports because they are often intended to improve production capacity or support long-term investment rather than meet immediate household spending needs.
The increase also reflects the international nature of modern technology supply chains. American companies depend on overseas manufacturers for specialized chips, industrial components, and advanced equipment that may not be readily available from domestic suppliers. As businesses expand their computing and production capabilities, demand for these imported products can remain strong even when tariffs increase purchasing costs. However, the August figures alone do not establish how much of the additional spending resulted from higher prices rather than increased equipment purchases.
AI Infrastructure Spending Adds to Technology Import Demand
Expanding artificial intelligence infrastructure has become an important source of demand for advanced computing equipment, semiconductors, and specialized machinery. US technology companies are investing in data centers and computing capacity to support increasingly demanding AI workloads, creating additional demand for hardware manufactured overseas. This investment provides context for the increase in technology-related imports, particularly as AI development requires substantial spending on processors, servers, networking equipment, and supporting infrastructure.
Reuters and other financial publications have linked the strength in capital goods imports to continued AI infrastructure investment. However, the official trade statistics do not identify exactly how much imported equipment was purchased for AI projects, and many semiconductor products serve industries beyond artificial intelligence. The figures therefore support a broader conclusion: US investment in advanced technology continues to rely partly on international supply chains, and expanding domestic computing infrastructure can increase imports before the resulting economic benefits appear in domestic production.
Why Did the US Trade Deficit Widen Despite Tariffs?
The US trade deficit widened in August 2026 despite the Trump administration's tariffs because domestic demand for foreign products remained strong. Tariffs increase the cost of imported goods, but they do not necessarily reduce purchases when American businesses depend on overseas suppliers for essential materials, equipment, and specialized components. Companies may also continue importing under existing supply contracts or absorb higher costs when domestic alternatives are limited. Strong consumer spending and business activity can therefore sustain import demand even as trade restrictions make foreign goods more expensive. The August figures suggest that tariff measures alone were insufficient to offset these broader economic forces during the month.
Tariffs can also change where businesses purchase goods without necessarily reducing the overall US trade deficit. Importers may shift orders toward countries with different tariff rates, while domestic production takes time to expand and replace established international supply chains. Meanwhile, the trade balance depends on several factors beyond import duties, including exchange rates, foreign demand for American exports, and changes in commodity prices. The August report does not establish how large the deficit would have been without tariffs, making it difficult to measure their effectiveness from a single month's data. A more reliable assessment requires examining longer-term trade patterns, import volumes, domestic production, and changes in sourcing across major trading partners.
US Trade Deficit by Country: Mexico, Vietnam, Taiwan, and China Lead the Gap
The US trade deficit with major trading partners remained substantial in August 2026, reflecting America's reliance on international manufacturing and supply chains. According to the US Bureau of Economic Analysis (BEA), Mexico, Vietnam, Taiwan, and China recorded the largest individual goods trade deficits with the United States. The country-level figures reveal where American imports exceeded exports and provide a clearer picture of the trade relationships behind the overall imbalance. These bilateral balances cover merchandise trade rather than the combined goods and services deficit.
Mexico, Vietnam
Mexico recorded the largest US goods trade deficit at $27.7 billion, followed by Vietnam at $24 billion. US imports from Mexico reached a record $60.6 billion, while imports from Vietnam climbed to an all-time high of $26.5 billion. Both countries remain important suppliers to American businesses, with Mexico closely integrated into North American manufacturing and Vietnam serving as a major production base for electronics, apparel, and consumer products. The record import values indicate continued purchasing from these markets, although they do not establish how much trade was redirected from other countries.
Taiwan, China
Taiwan accounted for an $18.3 billion US goods trade deficit in August, compared with $16.4 billion for China. Taiwan's position reflects its importance in global semiconductor manufacturing and advanced electronics supply chains, while China remains a major supplier of manufactured goods and industrial components. The larger monthly deficit with Taiwan illustrates the changing composition of US trade, particularly the growing importance of technology-intensive imports. However, bilateral deficits alone cannot establish whether these changes resulted from tariffs, shifts in production, or stronger demand for particular products.
Other Partners
Beyond the four largest bilateral deficits, the United States recorded goods trade shortfalls of $11 billion with the European Union, $9.4 billion with South Korea, and $6 billion with Malaysia. The deficit with Canada also increased by $4.1 billion to $7.1 billion, as US imports from its northern neighbor rose by $4.6 billion to $37.1 billion. These figures show that the August trade imbalance extended across several major trading relationships rather than being concentrated in a single country. They also demonstrate why changes in individual bilateral balances must be considered alongside overall import demand and export performance.
How the Widening US Trade Deficit Could Affect Q3 GDP and Economic Growth
US Trade Deficit Could Reduce Q3 GDP Growth
The widening US trade deficit could place significant pressure on third-quarter economic growth as higher net imports reduce the contribution of international trade to gross domestic product (GDP). According to Reuters, economists estimated that trade could subtract as much as 2.5 percentage points from annualized Q3 GDP growth. Following the August trade report, Goldman Sachs lowered its third-quarter growth forecast from 3.4% to 3.1%, reflecting the weaker contribution expected from net exports. The US economy expanded at an annualized rate of 2.2% in the second quarter, making the balance between domestic spending and international trade an important factor in the next GDP reading.
However, economic forecasts continue to differ because stronger consumer spending, business investment, and inventory accumulation may offset part of the trade-related slowdown. The Federal Reserve Bank of Atlanta's GDPNow model estimated third-quarter growth at 3.7% following its October 6 update, indicating that the broader economy could remain resilient despite weaker net trade. These projections are preliminary and depend on incoming economic data. The Bureau of Economic Analysis is scheduled to publish its advance estimate of Q3 GDP on October 29, 2026, providing a clearer assessment of how international trade affected overall economic activity.
Why Strong Imports Do Not Always Signal Economic Weakness
A larger trade deficit does not automatically mean the US economy is weakening. Under GDP accounting, imports are subtracted because they represent goods and services produced outside the country, while domestic consumption and investment contribute to economic activity. When American businesses purchase imported equipment, the spending can support investment even though the foreign-produced portion must be deducted from GDP. Strong import demand can therefore accompany economic expansion, particularly when companies are increasing production capacity and households continue spending. The effect on growth depends on changes in inflation-adjusted exports and imports rather than the headline dollar value of the trade deficit alone.
The distinction is especially important because August's inflation-adjusted goods deficit increased 8.2% to $114.7 billion, a smaller percentage rise than the nominal goods deficit. Meanwhile, August wholesale inventories increased 0.5%, according to figures released on October 8, suggesting businesses were rebuilding stocks alongside continued sales growth. Inventory accumulation can contribute positively to GDP when it reflects additional domestic production, although inventories of imported products require careful treatment in national accounts. For investors and policymakers, the key questions are whether domestic demand remains strong, how much production occurs within the United States, and whether persistent spending pressures influence inflation and future Federal Reserve interest-rate decisions.
Conclusion
The US trade deficit reaching $105.6 billion in August 2026 reflects sustained demand for imported energy, industrial materials, and advanced technology equipment. Although higher imports widened the monthly trade gap despite tariffs, the figures also point to continued business investment and the importance of international supply chains. The year-to-date improvement in the trade balance provides additional context, suggesting that one month's sharp increase should not be interpreted as evidence of a sustained deterioration in US trade performance.
The economic implications will become clearer as additional trade and GDP data are released. A larger deficit could reduce net exports' contribution to third-quarter growth, but strong domestic spending and capital investment may help offset that pressure. Investors will be watching the October 29 GDP estimate and November 4 trade report for evidence of whether August's import surge was temporary or part of a longer-term trend. The broader outlook will depend on domestic demand, global trade conditions, and how businesses adjust their investment and sourcing decisions.
-
One account for everything. Older platforms split your money across separate "spot," "margin," and "futures" accounts and expected you to understand why. KuCoin 5.0's unified account removes that entirely — deposit once, and everything is simply there (only available to VIPs for now).
-
Stocks, indices, and commodities. KuCoin 5.0 expands beyond crypto into global markets. When crypto chops sideways and equities rally (or the reverse), you rotate in minutes instead of opening a brokerage account and waiting days for fiat rails.
-
Real-world assets (RWA). Tokenized exposure to traditional assets like commodities, right inside your crypto account. One of the fastest-growing segments in global finance is no longer reserved for institutions — you access it from the same balance you trade with.
-
Earn while you learn. Not ready to trade? KCUSD lets your stablecoins earn daily, auto-compounding interest. The lowest-stress way to put your idle deposit to work for 4% yield.
-
An AI assistant in plain language. Ask questions, get market context, understand what you're looking at — built into the platform, no jargon required.
-
An app that doesn't overwhelm. Faster, cleaner, and consistent — intuitive from the first tap, not after a tutorial.
-
Safety you can check, not just trust. A MiCAR-licensed EU entity, Proof of Reserves you can verify yourself, and internationally certified security (SOC 2 Type II, ISO 27001:2022).
FAQs
1. Is the US trade deficit the same as the federal budget deficit?
No. The US trade deficit measures how much the country spends on foreign goods and services compared with what it earns from exports. The federal budget deficit measures how much government spending exceeds government revenue. They are separate economic indicators, although both can be influenced by broader economic conditions.
2. Are import tariffs included in the US trade deficit calculation?
Import duties are generally excluded from the customs value used in US merchandise trade statistics. Tariffs can still influence the trade balance indirectly by changing import prices, purchasing decisions, and supply chains. Their overall impact depends on how businesses and consumers respond to higher costs.
3. How does a stronger US dollar affect the trade deficit?
A stronger US dollar can make imported products cheaper for American buyers while making US exports more expensive for foreign customers. This may increase import demand and reduce export competitiveness. However, the outcome depends on exchange-rate movements, trade contracts, and how quickly businesses adjust their purchasing decisions.
4. Why are US trade deficit figures revised after publication?
The Bureau of Economic Analysis and Census Bureau revise trade statistics as additional customs records, business surveys, and more complete transaction data become available. Revisions may also reflect updated seasonal adjustments or corrected information. Consequently, previously reported import, export, and trade deficit figures can change in subsequent releases.
5. What does seasonally adjusted US trade data mean?
Seasonally adjusted trade figures account for recurring patterns that influence imports and exports during particular times of the year, including holidays, shipping schedules, and seasonal demand. These adjustments make month-to-month comparisons more meaningful. However, they do not eliminate unexpected fluctuations caused by economic developments or major international events.
6. Are products manufactured overseas by US companies counted as imports?
Yes. Goods manufactured abroad and brought into the United States are generally recorded as imports, even when the overseas factory belongs to an American company. Trade statistics primarily track cross-border transactions rather than the nationality of a company's owners. This distinction matters because multinational businesses often operate production facilities and supply chains across several countries.
7. What Is the Difference Between the US Trade Deficit and Current Account Deficit?
The US trade deficit measures the difference between exports and imports of goods and services. The current account deficit is broader because it also includes cross-border investment income and certain transfers, such as remittances. Both indicators help assess the United States' economic relationship with the rest of the world, but they measure different financial flows.
8. Does a Trade Deficit With Another Country Mean the US Is Losing Money?
Not necessarily. A bilateral trade deficit means the United States imports more goods or services from a particular country than it exports to that country. It does not measure the overall economic benefits of the relationship. American consumers and businesses receive products in exchange for their spending, while imported materials and equipment can support domestic production, employment, and investment.
Disclaimer
This article is for informational and educational purposes only and does not constitute financial or investment advice. Market conditions can change rapidly, and readers should conduct their own research and consider their financial situation and risk tolerance before making investment decisions.