

Bitcoin Falls Back Below $80K After $81K Rejection: Is the BTC Rally Losing Momentum?
2026/08/26 16:08:00
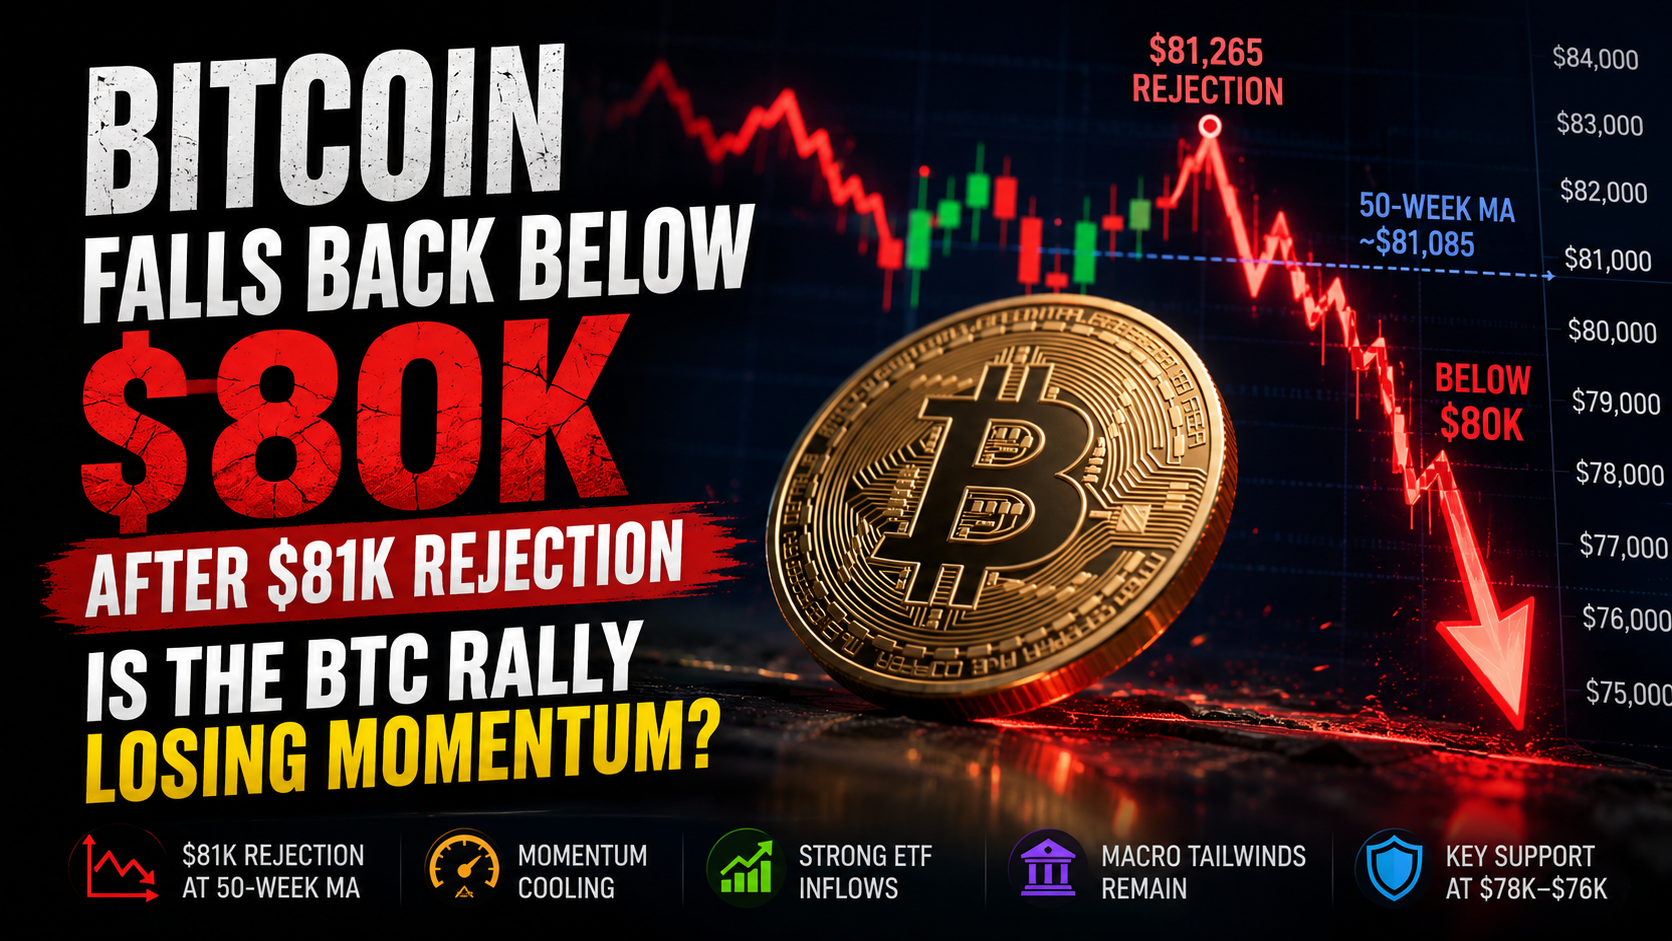
Bitcoin’s powerful recovery has encountered its first major long-term test. After climbing roughly 25% in less than a week and briefly reaching an intraday high of about $81,265, BTC failed to hold above $81,000 and slipped back below the psychologically important $80,000 level. The rejection occurred almost exactly where Bitcoin’s 50-week moving average sits, turning what might otherwise look like ordinary profit-taking into an important test of the broader market trend.
The pullback has raised an obvious question: Is the Bitcoin rally already losing momentum, or is BTC simply consolidating after an unusually fast advance? Short-term indicators clearly show that the market has become stretched, but spot Bitcoin ETF inflows remain strong and macro conditions have improved. The answer may ultimately depend on whether genuine spot demand can replace the short-covering that helped launch the rally and whether Bitcoin can eventually break the much more important $82,000–$83,000 resistance zone.
What Happened at the $81K Bitcoin Resistance?
Bitcoin’s latest rally accelerated rapidly after the price recovered from the mid-$60,000 region. By August 25, BTC had reached $81,265, its strongest level in months. The advance, however, stopped close to the 50-week moving average, which was near $81,085 at the time. Selling pressure quickly appeared, pushing Bitcoin back below $80,000 and toward the $79,000 area.
The timing of the rejection matters because several technical levels are clustered in a relatively narrow range. The 50-week moving average sits just above $81,000, while Bitcoin’s May swing high is near $82,814. Together, these levels create a broader resistance area between roughly $81,000 and $83,000 rather than a single barrier at one exact price.
| Bitcoin Price Zone | Market Significance |
| $78K–$79K | Immediate pullback and support area |
| $80K | Major psychological level |
| ~$81.1K | 50-week moving average |
| $82K–$83K | Major breakout and previous-high zone |
| $75K–$76K | Deeper support and on-chain reference area |
The result is a much more meaningful technical test than Bitcoin merely crossing another round number. The market has reached a zone capable of determining whether the recent advance remains a relief rally or develops into a more durable trend change.
Why the 50-Week Moving Average Matters
The 50-week moving average tracks Bitcoin’s average price over almost a full year, making it more useful for assessing longer-term market structure than shorter moving averages such as the 20-day or 50-day average. When Bitcoin trades persistently below it, the indicator can act as overhead resistance. Recovering the level can therefore signal that buyers are beginning to regain control over the broader trend.
Historical research highlighted by Galaxy Research makes the current test particularly interesting. CoinDesk reported that in 11 of 13 previous cases associated with the end of Bitcoin bear markets, the market bottom had already formed when BTC reclaimed its 50-week moving average. That does not make the indicator a guaranteed signal, but it helps explain why traders are paying so much attention to the current level.
A brief intraday move above the average would not be enough to confirm a structural change. What technicians generally want to see is a convincing weekly close above the 50-week moving average, followed by evidence that the level can hold as support. Bitcoin touching $81,000 and immediately retreating therefore shows that bulls have reached the test, but they have not yet passed it.
Why $82K–$83K Is the Real Breakout Zone
Even a clean recovery above the 50-week moving average would leave Bitcoin facing another important barrier. BTC’s previous May high sits around $82,814, just above the moving average. A sustained move beyond that level would carry greater significance because it could establish a new higher high relative to the previous major swing point.
This distinction matters in traditional market-structure analysis. A market characterized by lower highs can remain technically weak even after a large rebound. Breaking above a previous important high begins to challenge that pattern. For Bitcoin, the sequence would therefore be clearer if BTC first reclaimed the 50-week average and then moved decisively through the $82,000–$83,000 region.
That is why $80,000 should not be treated as the ultimate breakout level. Crossing $80K may attract headlines and improve sentiment, but a sustained break above $82K–$83K would offer considerably stronger evidence that Bitcoin is transitioning from a rebound into a broader bullish structure.
Is Bitcoin Losing Momentum?
In the short term, momentum has clearly cooled. Bitcoin rose roughly 25% in six days, pushing its 14-day Relative Strength Index to around 81.83. An RSI above 70 is generally considered overbought, while a reading above 80 reflects an especially rapid advance. The current reading was Bitcoin’s highest since March 2024, according to FactSet data cited by MarketWatch.
However, “overbought” should not be confused with “about to crash.” RSI measures the speed and magnitude of recent price changes; it does not dictate what happens next. Strong trending markets can remain overbought for extended periods. In March 2024, for example, Bitcoin reached an RSI of 85.89 and still gained another 7.6% before reaching its subsequent peak.
The more balanced interpretation is that Bitcoin has become vulnerable to consolidation or profit-taking after an unusually fast rise. The rejection near $81K fits that pattern, but the broader recovery has not automatically failed simply because BTC dropped below $80,000. Whether momentum is merely resetting or genuinely reversing will depend on support, spot demand and the next test of long-term resistance.
How the Short Squeeze Fueled Bitcoin’s Rally
One reason Bitcoin climbed so quickly was the liquidation of heavily leveraged bearish positions. Charles Schwab’s Jim Ferraioli estimated that about $6.4 billion in leveraged short perpetual futures positions had been liquidated during the rally. When traders betting against Bitcoin are forced to close positions as prices rise, they effectively become buyers, adding further upward pressure to the market.
The process can become self-reinforcing. Bitcoin rises, short positions reach liquidation thresholds, forced buying pushes BTC higher, and the next group of short sellers is then liquidated. This explains why short squeezes can produce unusually fast moves even when the initial catalyst appears relatively modest. The recent rally from the $60K region toward $80K was therefore not driven exclusively by investors voluntarily building long-term positions.
The limitation is equally important: short squeezes eventually run out of shorts to squeeze. Once a large portion of bearish leverage has been removed, forced buying becomes less powerful. Bitcoin then needs another source of demand to keep climbing. That transition—from liquidation-driven buying to genuine spot buying—is one of the most important issues facing the market now.
Can Bitcoin ETF Inflows Keep the Rally Alive?
The strongest argument that the rally has more support than a simple short squeeze is the return of substantial capital to U.S. spot Bitcoin ETFs. Farside Investors recorded about $337.6 million in net inflows on August 24 and another $314.3 million on August 25. Total cumulative net flows into U.S. Bitcoin ETFs had reached approximately $54.4 billion by August 25. BlackRock’s IBIT alone attracted roughly $284.4 million during the latest reported session.
That creates an important distinction. Short liquidations represent forced demand, while ETF inflows represent capital being deliberately allocated to spot-linked Bitcoin investment products. CoinDesk noted that the preceding six-session ETF inflow streak had already brought in more than $2.5 billion, providing evidence that real investment demand was supporting a rally that initially relied partly on short covering.
ETF flows are still not a guarantee of higher prices. They can reverse quickly, and Bitcoin remains sensitive to macroeconomic conditions, profit-taking and derivatives positioning. Nevertheless, if ETFs continue attracting hundreds of millions of dollars while short-liquidation activity fades, the quality of the rally would improve. For that reason, daily Bitcoin ETF flows may now be more important than another round of short liquidations.
What Pushed Bitcoin Higher in the First Place?
The rally also developed against a more supportive macroeconomic backdrop. The U.S. Treasury’s decision to expand purchases of longer-dated government bonds helped revive expectations of lower long-term yields and contributed to weakness in the U.S. dollar. Investors also began discussing the policy through the lens of currency debasement, supporting demand for scarce assets such as gold and Bitcoin. Reuters reported that BTC rose above $80,000 as the softer dollar and renewed debasement concerns boosted demand.
Bitcoin’s August performance has consequently been unusually strong. Reuters reported that BTC was up about 28% for the month as of August 25, putting it on course for its strongest monthly gain since November 2024. Expectations for clearer U.S. crypto regulation have also contributed to improving sentiment, while the recovery in ETF flows has given traditional investors another channel to participate in the move.
The rally is therefore better understood as the result of several forces operating together: softer dollar conditions, fiscal and bond-market developments, regulatory optimism, renewed ETF buying and a large short squeeze. That mix also explains why a single technical rejection at $81K is not enough by itself to determine where Bitcoin goes next.
Is $79K Support Strong Enough?
After failing near $81K, Bitcoin moved back toward the $79,000 area. If buyers consistently emerge around $78K–$79K, the market could establish a relatively normal pattern of breakout, resistance test, pullback and consolidation. Such a structure would allow momentum indicators to cool without requiring Bitcoin to erase a large portion of the recent advance.
However, traders should avoid treating $79K as an absolute line between bullish and bearish conditions. A deeper support region exists around $75,000–$76,000. CoinDesk highlighted a “true market mean” of approximately $75,968, an on-chain measure intended to represent the average acquisition price of actively circulating Bitcoin excluding miner holdings. Bitcoin had already found support around this region during a previous weekend pullback.
A move into that zone would represent a larger correction, but not necessarily the end of the entire recovery. The quality of the pullback would matter more than the exact price. Continued ETF inflows, healthy spot volumes and the absence of excessive new leverage could allow the market to reset. By contrast, falling prices accompanied by ETF outflows and weakening spot demand would provide stronger evidence that the $81K rejection marked something more serious.
Bullish vs Bearish Bitcoin Scenarios
Bitcoin is currently positioned between strong underlying demand signals and stretched short-term technical conditions. That makes it more useful to think in scenarios rather than assume one directional outcome.
| Scenario | What Would Matter |
| Bullish Breakout | BTC reclaims the 50-week average and breaks $82K–$83K |
| Sideways Consolidation | BTC holds roughly $78K–$81K while momentum cools |
| Deeper Pullback | BTC retests the $75K–$76K support region |
| Bearish Failure | Major support breaks while ETF and spot demand weaken |
The bullish case would become stronger if Bitcoin retakes approximately $81K, secures a weekly close above the 50-week moving average and then breaks the May high near $82.8K. That sequence would improve the market’s higher-time-frame structure and indicate that genuine demand is strong enough to absorb profit-taking after the recent surge.
A neutral outcome could involve several days or weeks of trading between approximately $78K and $81K. That would allow RSI and speculative positioning to normalize without destroying the broader recovery. The bearish scenario becomes more compelling if BTC loses $78K, fails to stabilize around $75K–$76K and simultaneously sees ETF flows turn persistently negative. In that case, the $81K move would increasingly resemble a failed breakout rather than simple consolidation.
What Would Confirm the BTC Rally Is Still Strong?
Price alone will not provide the full answer. The strongest confirmation would combine several signals: Bitcoin reclaiming its 50-week moving average, breaking the previous major swing high and doing so while spot buying remains strong. Continued ETF inflows would help demonstrate that the rally is being funded by investors rather than mainly by traders closing losing short positions.
Derivatives conditions also matter. A market that immediately rebuilds excessive leverage after a short squeeze may become vulnerable to another violent liquidation cycle. By contrast, rising prices supported by spot purchases while futures leverage remains relatively controlled would represent a healthier structure. CoinDesk has already highlighted that the sustainability of the current move increasingly depends on spot buying as the initial short squeeze fades.
The ideal bullish confirmation would therefore not be one dramatic daily candle. It would be a combination of higher prices, strong spot demand, continued ETF inflows and improved longer-term market structure. That would offer much stronger evidence of a durable trend change than simply seeing Bitcoin briefly trade above $80,000 again.
What to Watch Next for Bitcoin
The immediate focus remains the $81K–$83K region. Bitcoin’s 50-week moving average near $81K is the first barrier, while the previous high around $82.8K provides the next structural test. A weekly close through this area would substantially strengthen the bullish case. On the downside, $78K–$79K is the first area to watch, followed by the more important $75K–$76K region if selling intensifies.
ETF data may be just as important as price. The August 24 and August 25 sessions together brought in more than $650 million, extending the return of institutional capital to spot Bitcoin products. If that trend continues during price weakness, it would suggest investors are using pullbacks to build exposure. If the flow trend reverses just as Bitcoin struggles below resistance, the market would lose one of its strongest current sources of support.
Finally, the macro environment remains relevant. Dollar movements, Treasury yields, U.S. fiscal policy and expectations around crypto regulation helped create the backdrop for the current rally. Bitcoin’s next major move will therefore depend on more than chart levels. The central question is whether genuine demand can keep expanding after the forced buying that powered the early phase of the rally begins to fade.
Conclusion
Bitcoin’s fall below $80,000 after being rejected near $81,000 shows that short-term momentum is cooling, but it does not yet confirm that the broader rally has failed. BTC has reached an unusually important cluster of long-term resistance, including the 50-week moving average near $81K and the previous major high around $82.8K. Breaking that zone would provide much stronger evidence of a structural trend reversal than simply recovering the $80,000 psychological level.
For now, the market is caught between stretched momentum and improving underlying demand. The short squeeze that helped accelerate Bitcoin’s rise cannot continue indefinitely, making spot ETF inflows increasingly important. If BTC can hold key support while institutional buying persists and eventually break $82K–$83K, the rally could develop into something more durable. If support fails as ETF demand weakens, the $81K rejection may instead prove to have been an early warning that the recovery moved too far, too quickly.
FAQs
What Does It Mean When Bitcoin Is Overbought?
An overbought reading means Bitcoin has risen unusually quickly according to momentum indicators such as RSI. It signals stretched conditions, but it does not guarantee an immediate price decline.
What Is the Difference Between Bitcoin Support and Resistance?
Support is a price area where buying demand may slow declines, while resistance is an area where selling pressure may make further gains more difficult.
Why Does Bitcoin Trade 24 Hours a Day?
Bitcoin trades on global cryptocurrency markets that operate continuously, including weekends and holidays, unlike traditional stock exchanges with fixed trading sessions.
Can Bitcoin ETFs Trade When BTC Moves on the Weekend?
U.S.-listed Bitcoin ETFs generally do not trade when stock exchanges are closed. If Bitcoin moves sharply over the weekend, ETF shares may adjust when the traditional market reopens.
What Is a Bitcoin Weekly Close?
A weekly close is the price at which Bitcoin’s weekly trading candle ends. Technical analysts often use weekly closes to judge whether important long-term levels have been convincingly broken.
Does Bitcoin Always Move Opposite to the U.S. Dollar?
No. Bitcoin and the dollar can show an inverse relationship during some periods, but the correlation changes over time and is influenced by liquidity, interest rates, investor sentiment and other macroeconomic factors.
🔥 KuCoin Offers A More Stable Option in A Volatile Market
If you worry about the frequent ups and downs in the market, and pursue a more stable option to earn money passively, KuCoin is the right place to come:

Simple Earn: Deposit and withdraw tokens anytime, earning stable returns.
Kucoin Earn: Earn stable profits with professional asset management.
Hold to Earn: Earn rewards by holding assets in Funding, Trading, Margin, Futures, Mining, and Unified Accounts.
Staking: Unlock the earning potential of on-chain assets.
Advanced Investments: Advanced Investments offer a variety of structured products to help your money grow in any market.
Shark Fin: Principal Protection and Guaranteed Gains
Dual Investment: Buy low and sell high with transparent return calculations.
Snowball: High yields, with price protection.
Discount Buy: Buy crypto at discount prices.
KCS Loyalty: Level up to enjoy exclusive perks by staking ≥ 1 KCS.
KuCoin Wealth: Discover future value and begin your smart investing journey.
KCS Benefits: Hold and stake KCS to access benefits across the platform.
KCS Staking 2.0: Participate in KCS on-chain governance to earn yield.
Disclaimer: This content is for informational purposes only and does not constitute investment advice. Cryptocurrency investments carry risk. Please do your own research (DYOR).