

Understanding S&P 500 Market Breadth: What Rising 50-Day and 200-Day Moving Average Readings Signal for Crypto Traders
Introduction
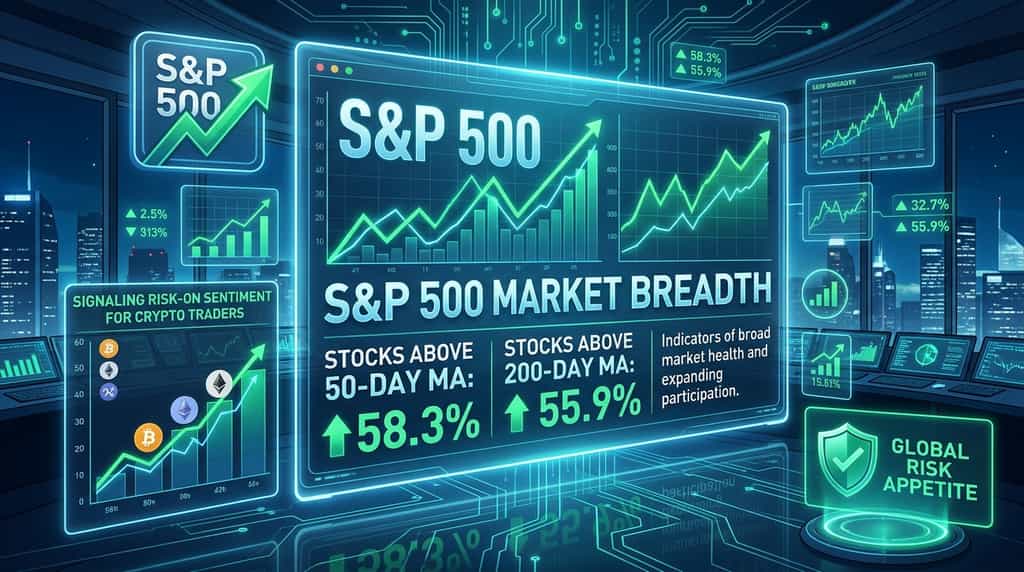
Market breadth within equity benchmarks serves as a primary gauge of underlying financial market health, reflecting how widely price advances are distributed across individual equities rather than being driven by a handful of mega-cap technology stocks. According to market breadth metrics reported by MacroMicro and financial indexing datasets in October 2026, the percentage of S&P 500 constituents trading above their 50-day moving average sharply rose from a low of 35.2% to 58.3% over a 10-session period ending October 23, 2026. Meanwhile, the proportion of constituents exceeding their 200-day moving average reached 55.9%.
This expanding market breadth indicates that equity market participation is broadening significantly across diverse sectors. For digital asset market participants, tracking equity market breadth offers crucial insights into macroeconomic risk appetite, liquidity dynamics, and potential capital rotation patterns between traditional capital markets and decentralized financial assets.
What Is Market Breadth and How Do 50-Day and 200-Day Moving Averages Measure It?
Market breadth quantifies market participation by tracking the proportion of individual components within an index that participate in a broader price move. Unlike market-capitalization-weighted indices like the S&P 500—where mega-cap companies exert a disproportionate influence on overall index direction—breadth indicators evaluate every stock equally regardless of size.
According to quantitative market data from specialized analysis platforms in October 2026, two primary technical indicators are utilized to measure short-term and long-term trend health:
-
The 50-Day Moving Average (50-DMA) Breadth: Measures short-term market momentum and intermediate tactical strength. When the percentage of stocks above their 50-DMA rises, it confirms immediate buying interest spreading across cyclical and defensive sectors alike.
-
The 200-Day Moving Average (200-DMA) Breadth: Evaluates structural long-term bull market participation. A reading above 50% indicates that the majority of underlying companies remain in sustained long-term uptrends.
When both indicators advance simultaneously, technical analysts interpret the signal as structural confirmation of bull market health rather than a fragile rally driven solely by narrow corporate concentration.
Why Is S&P 500 Market Breadth Improving in Late 2026?
The expansion in U.S. market participation reflects broad-based sector rotation, solid corporate earnings performance, and easing macroeconomic pressures across global financial markets. According to statistical reporting on index participation as of October 23, 2026, 58.3% of eligible S&P 500 stocks closed above their 50-day moving average, significantly outperforming broader U.S. equity common stocks at 33.4%.
| Indicator Metric | S&P 500 Index Coverage | Broader U.S. Equity Market | Participation Gap |
| Stocks Above 50-Day MA | 58.30% | 33.40% | +24.9 Percentage Points |
| Stocks Above 200-Day MA | 55.90% | 38.20% | +17.7 Percentage Points |
This large-cap outperformance highlights several key macro catalysts:
-
Sector Rotation Away from Concentrated Mega-Cap Tech
Throughout earlier market cycles, index gains were heavily concentrated in top-tier technology giants. Recent data confirms capital dispersing into industrials, financials, healthcare, and consumer sectors, creating a stable floor for equity valuations.
-
Stabilization of Institutional Risk Appetite
As macroeconomic uncertainty subsides, institutional asset managers expand their capital allocations into mid-cap and value equities. Increasing participation above 200-day moving averages demonstrates institutional accumulation across a broader spectrum of corporate balance sheets.
How Does Rising Equity Market Breadth Impact Cryptocurrency Markets?
Improving stock market breadth positively influences digital asset markets by bolstering global risk-on sentiment and expanding systemic financial liquidity. According to correlation tracking between traditional equity indices and major digital assets, cryptocurrency prices frequently exhibit strong positive sensitivity to broader financial risk appetite.
-
Validation of Genuine Risk-On Sentiment
Narrow rallies—where index gains are driven by only 5 to 10 mega-cap stocks—often indicate fragile market sentiment prone to sudden liquidity contractions. Conversely, broad market participation signals genuine investor confidence, creating a stable macroeconomic backdrop that encourages capital deployment into higher-beta asset classes like Bitcoin (BTC), Ethereum (ETH), and altcoins.
-
Institutional Portfolio Rebalancing and Spillover Liquidity
When institutional portfolios experience broad capital appreciation across diversified equity holdings, portfolio risk models allow for increased allocations to alternative assets. Profits generated from traditional equity rallies frequently flow into spot digital asset products, decentralized financial protocols, and Web3 infrastructure investments.
What Are the Key Differences Between S&P 500 Breadth and Crypto Market Participation?
While equity market breadth relies on traditional moving average metrics across 500 corporate constituents, cryptocurrency market breadth is evaluated through alternative liquidity indicators across decentralized networks.
-
Market Concentration Dynamics
The S&P 500 measures breadth by counting how many constituent stocks trade above technical moving averages. In cryptocurrency markets, breadth is measured by metrics such as Bitcoin Dominance Index (BTC.D), the percentage of altcoins outperforming Bitcoin, and overall active wallet address growth across major Layer-1 and Layer-2 blockchains.
-
Continuous Liquidity and Settlement Speed
Traditional equity markets operate within set trading hours, meaning moving average updates occur on daily closes. Digital asset markets operate 24/7 with continuous settlement, allowing crypto market participation metrics—such as decentralized exchange (DEX) trading volume distribution and stablecoin circulation—to adjust dynamically to macroeconomic shifts in real time.
What Risks Should Traders Watch When Interpreting Market Breadth Signals?
Rising market breadth indicators provide valuable bullish context, but traders must evaluate potential technical divergences and macroeconomic headwinds before making capital allocation decisions.
-
Bearish Breadth Divergences: If major stock indices reach new all-time highs while the percentage of stocks above their 50-day or 200-day moving averages begins to decline, it signals underlying momentum exhaustion.
-
Macroeconomic Policy Shifts: Sudden changes in central bank interest rate policies or unexpected inflationary pressures can rapidly contract market liquidity, leading to sharp sell-offs in both traditional equities and digital assets.
-
Short-Term Volatility Mismatches: Single-day advance-decline ratios can diverge from longer-term moving averages. For example, on October 23, 2026, despite 58.3% of S&P 500 stocks holding above their 50-day average, daily session breath saw 136 advances versus 363 declines due to short-term profit taking.
Conclusion
Improving S&P 500 market breadth—highlighted by 58.3% of constituents trading above their 50-day moving average and 55.9% above their 200-day moving average in late October 2026—demonstrates structural strength and broad participation across global capital markets. This expansion signals that current market advances are backed by widespread institutional buying rather than isolated mega-cap concentration.
For digital asset investors, rising equity participation validates broader macroeconomic risk appetite and supports favorable liquidity conditions for crypto markets. By analyzing market breadth alongside on-chain digital asset metrics, traders can effectively identify market cycles, manage portfolio risk, and capture high-conviction trading opportunities on KuCoin.
Frequently Asked Questions
What does market breadth mean in financial markets?
Market breadth measures the underlying level of participation in an index advance or decline by tracking how many individual stocks are moving in tandem with the benchmark index.
What is a good threshold for the 50-day moving average breadth indicator?
A reading above 50% indicates that a majority of index constituents are in short-term uptrends. Readings above 70% reflect strong bullish momentum, while readings below 30% suggest oversold conditions.
How does S&P 500 market breadth affect Bitcoin and altcoins?
Improving equity breadth reflects healthy global financial liquidity and investor risk appetite, which historically correlates with increased capital flows into spot digital assets and altcoin markets.
Why can market breadth improve even if the main index pulls back on a given day?
Moving averages evaluate price closes over multi-week or multi-month periods. Therefore, long-term breadth readings can remain high even during single-day market pullbacks or short-term consolidation sessions.
How do traders use market breadth to spot market tops?
Traders look for negative divergences, where the main benchmark index makes a new high while the percentage of stocks above their 50-day or 200-day moving averages makes lower highs, signaling weakening internal support.
Disclaimer
This general market information, possibly from third-party, commercial, or sponsored sources, is provided for reference and educational purposes only and does not constitute financial or investment advice, an offer, solicitation, or guarantee. We disclaim liability for its accuracy, completeness, reliability, and any resulting losses. Investments/trading are risky; past performance doesn’t guarantee future results. Users should research, judge prudently, and take full responsibility. For further details, please consult KuCoin’s Terms of Use and Risk Disclosure.