

Is Bitcoin Selling Pressure Near a Historic Bottom? Glassnode Identifies $62K as a Critical Support Level
Introduction
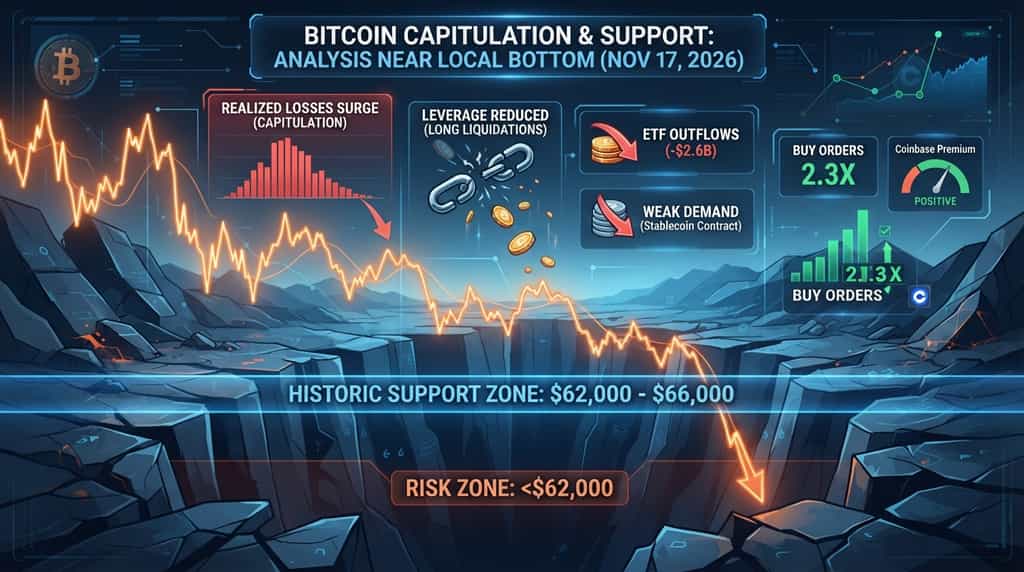
Bitcoin's latest sell-off has pushed several on-chain indicators toward levels historically associated with local market bottoms. In its November 17, 2026, report, Glassnode's The Week On-chain: Capitulation Meets Support found that realized losses had reached a magnitude previously observed near major lows in 2018, 2020, 2022, and early 2023. Meanwhile, Bitcoin is testing a significant support zone between $62,000 and $66,000, where recent buyers accumulated substantial holdings.
The data suggests that considerable selling and leveraged liquidations have already taken place. However, Glassnode does not confirm that Bitcoin has reached a durable bottom. Stablecoin supply is contracting, US spot Bitcoin ETFs have recorded substantial net outflows, and mining companies have sold BTC to fund business transitions. Whether buyers can continue absorbing supply around $62,000 may determine the market's next move.
Quick Answer: Is Bitcoin Selling Pressure Near a Historic Bottom?
Bitcoin price is showing several signs of capitulation historically associated with local market bottoms, but weak demand means a sustained reversal is not yet confirmed.
-
Realized losses have surged: The scale of loss-taking is comparable to levels observed near several previous market lows.
-
$62,000-$66,000 is a key support zone: This range absorbed approximately 66,000 BTC during the two days of heaviest recent selling.
-
Leverage has been substantially reduced: Large liquidations of leveraged long positions on November 13 and 14 removed considerable derivatives exposure.
-
Broader demand remains weak: Stablecoin supply contracted by 4.2% over 90 days, while US spot Bitcoin ETFs recorded approximately $2.6 billion in net outflows over 10 trading days.
-
Two price levels are particularly important: A daily close below $62,000 could expose Bitcoin to $58,500 and $53,700. Reclaiming $74,100 would strengthen the case for a developing bottom.
Why Does Glassnode Say Bitcoin Selling Pressure Is Near Historic Bottom Levels?
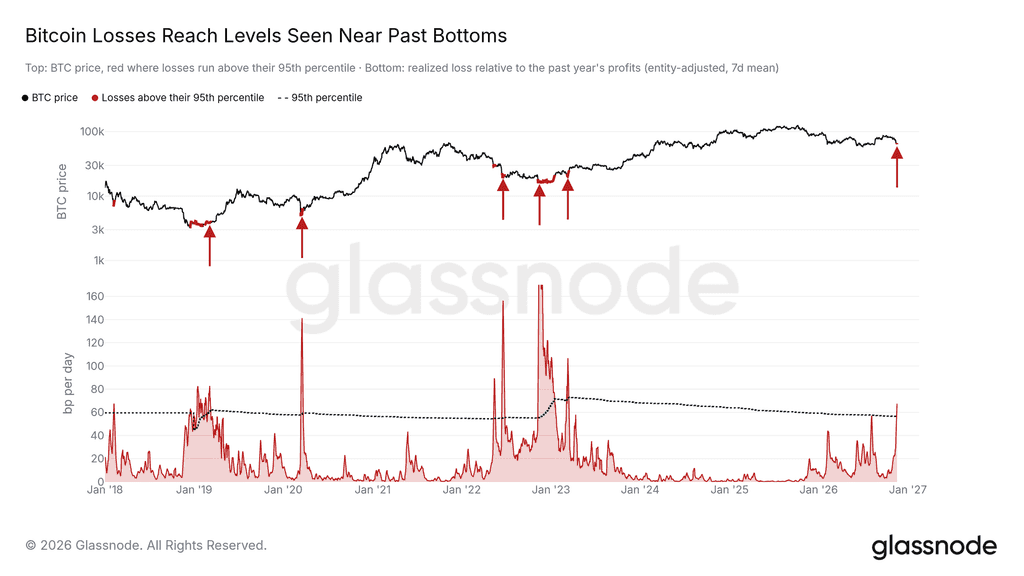
Glassnode's assessment is primarily based on realized losses, an on-chain metric that measures the losses investors lock in when Bitcoin moves at a price below its previous acquisition price.
In its November 17 report, Glassnode compared realized losses with the profits realized over the preceding year. The resulting measure reached a level previously observed near major market lows in 2018, 2020, 2022, and early 2023. According to the report, this is the first comparable reading since those periods.
Source: Glassnode, as of Nov 17, 2026
This pattern is associated with market capitulation. During a prolonged decline, investors who purchased Bitcoin at higher prices may eventually sell at a loss rather than continue holding through further volatility. When this behavior becomes widespread, realized losses can increase sharply as coins change hands at increasingly unfavorable prices.
However, historically elevated realized losses do not establish that the current price is the final market low. The metric records losses that investors have already realized; it does not measure how much potential selling remains. Similar readings have appeared near previous bottoms, but prices can continue falling if demand remains insufficient to absorb available supply.
Are Short-Term Bitcoin Holders Driving the Selling Pressure?
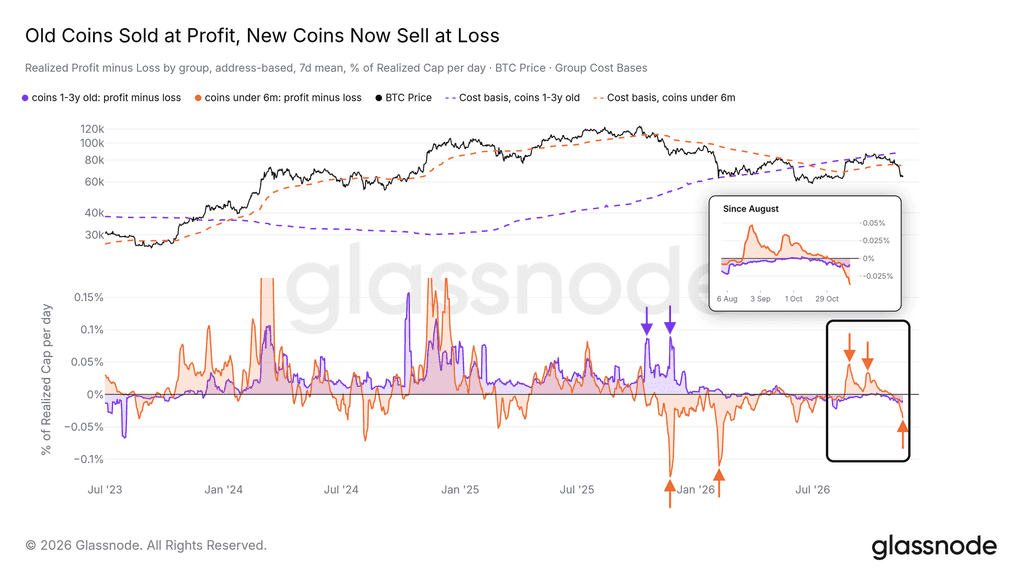
Recent buyers appear to be an important source of the current loss-taking activity. Glassnode's analysis indicates that holders whose coins are less than six months old have experienced substantial losses during the latest decline.
These investors had already faced losses during the earlier weakness in 2026, before benefiting from the recovery into September and October. The latest sell-off pushed Bitcoin below the average acquisition prices of several recent buyer groups, leaving some holders with an incentive to realize losses.
By comparison, investors holding coins for one to three years had realized substantial profits during late 2025, but their activity has since become less prominent. This suggests that the latest selling wave is more closely associated with recent market participants than with widespread distribution by longer-term holders.
Source: Glassnode, as of Nov 17, 2026
The distinction matters because short-term holders may be more sensitive to price fluctuations and changes in market sentiment. Nevertheless, holding duration alone cannot establish an investor's intentions or predict whether these investors will continue selling.
Can Bitcoin Hold the $62,000-$66,000 Support Zone?
The $62,000-$66,000 range is a significant near-term support area because it contains a large concentration of recent Bitcoin purchases. Glassnode's Short-Term Holder Cost Basis Distribution shows that approximately one-fifth of short-term holders' supply is concentrated in this zone.
The range developed around the August market low. During the two days of the most intense recent selling, its accumulated supply increased by approximately 66,000 BTC, indicating that buyers absorbed a considerable amount of the Bitcoin being sold.
This concentration matters because it represents a large group of recent buyers whose average acquisition prices are close to the current market price. If Bitcoin remains above the range, some of these investors may face less immediate pressure to realize additional losses. If the price falls decisively below it, however, more recent buyers could move further underwater, potentially increasing selling pressure.
Has Bitcoin Leverage Been Flushed Out?
The latest decline has removed a substantial amount of leveraged long exposure, reducing one potential source of forced selling. Glassnode reported that November 13 and 14 saw some of the largest long liquidations relative to futures open interest since 2023.
Open interest measures the outstanding value or number of derivatives contracts that have not yet been settled. When leveraged long positions are liquidated, exchanges forcibly close positions that no longer meet margin requirements. These closures can accelerate price declines because liquidations may generate additional market sell orders.
Glassnode's liquidation heatmap shows that much of the long exposure previously concentrated above $62,000 has already been cleared. However, a remaining cluster is located between approximately $59,500 and $62,200. A renewed decline into this range could therefore trigger another round of forced closures.
The reduction in leverage has two implications. First, fewer outstanding leveraged positions may reduce the immediate risk of another liquidation cascade around the current price. Second, the remaining concentration below $62,000 means that the market is not entirely free from liquidation risk.
Importantly, lower leverage does not necessarily indicate stronger underlying demand. A market can become less vulnerable to derivatives-driven selling while still lacking sufficient spot buying to sustain a recovery.
Why Does Weak Bitcoin Demand Remain a Major Risk?
Despite the signs of capitulation, Glassnode's report identifies several indicators suggesting that broader demand remains weak.
First, aggregate stablecoin supply declined by 4.2% over the 90 days covered by the report. Stablecoins are commonly used as settlement assets and liquidity reserves across digital asset markets. A decline in their overall supply can indicate that the amount of capital available within the crypto ecosystem is contracting. However, stablecoin supply alone cannot establish how much capital is ready to purchase Bitcoin.
Second, US spot Bitcoin ETFs recorded approximately $2.6 billion in net outflows over the 10 trading days ending November 13. ETF flows provide one measure of demand through traditional investment products. Sustained net outflows suggest that investors have been reducing exposure rather than consistently adding capital during the decline.
Third, mining companies have become another source of potential supply. According to Glassnode, MARA and Riot sold approximately 28,000 BTC during November to help fund their transitions toward AI and high-performance computing data center operations. These corporate sales represent a different source of selling activity from individual investor capitulation.
Taken together, these developments explain why the current market structure remains uncertain. The reduction in leverage and the absorption of selling around $62,000-$66,000 are constructive signs, but they do not necessarily mean that new capital is entering the market at a sufficient scale.
Are Buyers Returning to the Bitcoin Market?
There are some early signs of buying interest around the recent low, although the evidence remains mixed. Glassnode reported that resting buy orders on Binance and Coinbase within 5% of Bitcoin's price outweighed sell orders by approximately 2.3 times. The largest individual bid concentration was around $60,000, representing the strongest single bid level on Binance since August.
Glassnode also observed that market orders had shifted toward net buying over the 24 hours covered by its report, following heavy selling during the decline. This suggests that some buyers were willing to absorb available supply around the recent low.
The Coinbase Premium provided another signal. This metric compares Bitcoin's price on Coinbase with its global market price and is often used to assess relative buying activity from US market participants. After remaining negative for much of the period since late October, it turned positive around the November 15 low before slipping back to a small discount.
These developments indicate that buying interest emerged during the sell-off, but they do not yet establish a sustained return of demand. Resting orders can be canceled before execution, and a temporary positive Coinbase Premium may not persist. A more convincing recovery would require these signals to remain constructive alongside improving ETF flows and broader spot-market activity.
Conclusion
Bitcoin's latest sell-off has produced several conditions historically associated with local market bottoms. Glassnode's November 17, 2026, report identifies realized losses at levels comparable to those observed near previous major lows, alongside substantial liquidations of leveraged long positions. The $62,000-$66,000 range has also absorbed approximately 66,000 BTC during concentrated selling, making it an important near-term support area.
However, these developments do not establish that Bitcoin has completed its decline. Stablecoin supply has contracted, US spot Bitcoin ETFs have recorded significant outflows, and mining company sales have added to the available supply. If Bitcoin records a daily close below $62,000, the market could face further pressure toward $58,500 and the realized price near $53,700.
A sustained recovery above the $74,100 Short-Term Holder Cost Basis, supported by stronger spot demand and improving liquidity, would provide more convincing evidence of a developing bottom. Until these conditions emerge together, the current market is better described as a potential capitulation phase than a confirmed reversal.
FAQs
-
What does Bitcoin realized loss mean?
Bitcoin realized loss measures the value of losses investors lock in when coins move at prices below their previous acquisition prices. Rising realized losses indicate that more Bitcoin is changing hands below the prices at which it was previously acquired.
-
Does high realized loss mean Bitcoin has reached its bottom?
No. High realized losses can occur near market bottoms because investors capitulate during periods of extreme stress, but the indicator does not identify the exact low. Further declines can occur if demand remains weak or selling continues.
-
Why is the $62,000-$66,000 range important for Bitcoin?
The range contains approximately one-fifth of short-term holders' Bitcoin supply, according to Glassnode. It also absorbed around 66,000 BTC during two days of heavy selling, making it an important area for assessing whether buyers can continue absorbing supply.
Disclaimer
This general market information, possibly from third-party, commercial, or sponsored sources, is provided for reference and educational purposes only and does not constitute financial or investment advice, an offer, solicitation, or guarantee. We disclaim liability for its accuracy, completeness, reliability, and any resulting losses. Investments/trading are risky; past performance doesn’t guarantee future results. Users should research, judge prudently, and take full responsibility. For further details, please consult KuCoin’s Terms of Use and Risk Disclosure.