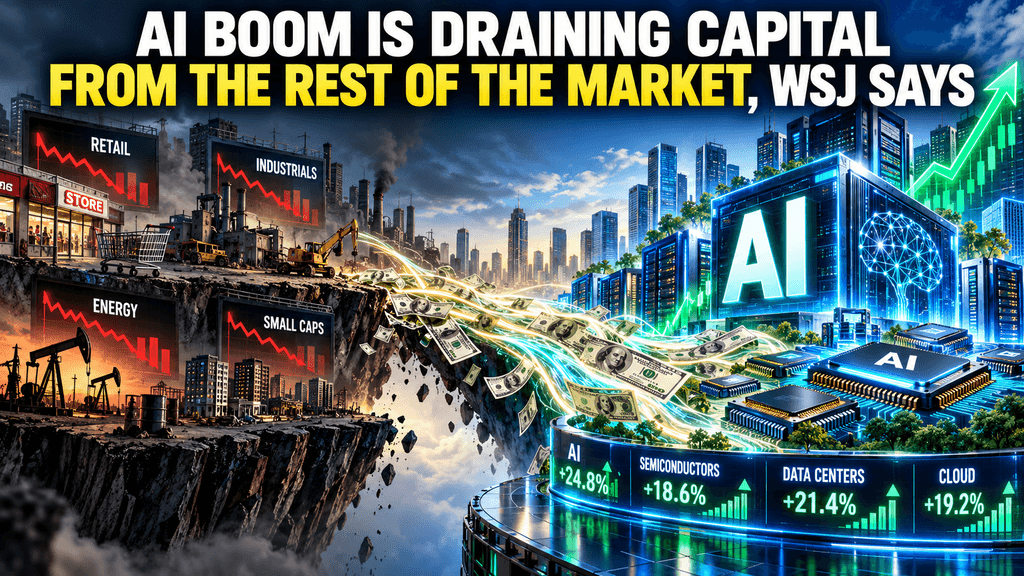
AI Boom Is Draining Capital From the Rest of the Market, WSJ Says
AI Boom Is Draining Capital From the Rest of the Market, WSJ Says
AI Capital Surge Narrows Market Gains and Raises Costs for Non-AI Stocks
Artificial intelligence infrastructure buildouts now absorb hundreds of billions in capital, reshaping U.S. markets. Hyperscalers channel funds into data centers, chips, and power systems, driving gains for a narrow equity group while non-AI stocks face higher borrowing costs and weaker relative performance. Data-center construction expands as housing and traditional industrial investment slows. Interest rates rise with AI-related demand, transmitting pressure to rate-sensitive sectors. Equity concentration intensifies, with AI-linked firms dominating index returns.
Free cash flow at several large technology companies has tightened, increasing debt reliance. Venture capital skews heavily toward AI, limiting funds elsewhere. These patterns appear in market data and reporting through early October 2026. The core development is that large-scale AI capital expenditure diverts resources and raises financing costs for the rest of the economy, producing a narrower equity market where non-AI stocks confront higher rates and slower earnings growth.
Narrow Equity Gains Reflect AI Capital Concentration
The latest index performance shows capital concentrated in AI-exposed names. A limited set of stocks drives most S&P 500 advances while remaining constituents lag. This pattern held into early October 2026, with market breadth constrained. Investor preference for growth narratives combines with physical capital absorption into AI infrastructure. Higher interest rates, partly from AI borrowing, raise costs for companies outside this circle. Oil prices add pressure for firms lacking an AI story. Earnings growth outside the AI cohort expands more slowly.
Credit concerns appear in segments reliant on accessible financing. Equity tracking data confirm the divergence, leaving non-AI stocks without offsetting technology catalysts. The effect remains structural while AI spending stays elevated. Portfolio implications include reduced diversification benefits from broad indexes. Companies without direct AI exposure must emphasize operational efficiency and balance-sheet strength. Market participants monitoring breadth indicators note shorter periods of broad participation. Valuation frameworks apply higher growth multiples to AI-linked names and more cautious assumptions elsewhere.
Hyperscaler Capex Hits Macro Scale in 2026
Capital expenditure by leading technology firms now registers at the macroeconomic level. Combined hyperscaler spending approaches $780 billion for 2026, a large share of U.S. private investment. Outlays cover processors, servers, networking, and data center construction. Financing has shifted toward debt as free cash flow tightens. The five largest hyperscalers issued about $132 billion in debt in the first eight months of 2026. National accounts show strong growth in information-processing equipment alongside flatter activity elsewhere.
Technology accounts for roughly 55 percent of U.S. capital spending, according to recent analysis. The volume creates feedback loops supporting near-term growth metrics while constraining alternative uses of capital. Earnings reports highlight the gap between revenue strength and free-cash-flow pressure. Practical effects include delayed non-AI industrial projects facing higher material and labor costs. Market sensitivity to any slowdown in AI capital deployment has increased. Supporting statistics on debt volumes and capex forecasts provide a quantitative foundation for the concentration assessment.
Interest Rates Transmit Pressure to Non-AI Sectors
AI project volumes contribute to higher interest rates, raising costs across the economy. Rate-sensitive areas such as commercial real estate, housing, and capital-intensive manufacturing feel the impact most. Commercial real estate deals have encountered financing difficulties. Data centers compete for labor and materials needed by other projects. Electricity demand keeps energy prices elevated in some regions. Chip shortages and price rises affect autos and consumer electronics.
These channels create multi-faceted constraints on non-AI investment. Economic commentary in early October 2026 links the private AI surge directly to rate pressure. Construction spending differentials illustrate the resource shift. Non-AI firms must adjust budgets or accept higher financing costs, slowing earnings growth outside the AI group. Transmission through rates affects firms regardless of direct AI exposure. Recent analysis notes the rate spike is felt throughout the non-AI economy, reinforcing relative underperformance of broader equity indexes.
Venture Capital Flows Concentrate in AI
Venture capital allocation skews heavily toward AI-related companies. AI captured roughly 65 percent of U.S. venture deal value in recent figures, continuing into 2026. Large funding rounds favor model developers, infrastructure providers, and related applications. Less capital remains for biotechnology, advanced materials, or traditional software. Startups outside AI report longer fundraising cycles and selective investor interest. The preference has become structural.
Non-AI innovators face slower growth trajectories when dependent on external equity. Deal-value statistics quantify the skew. This diversion reinforces concentration already visible in public markets and corporate investment. Firms in alternative fields need clearer profitability paths to compete for attention. The funding environment amplifies advantages for AI businesses. Capital decisions at the venture stage feed into public-market concentration as heavily funded private firms remain AI-linked.
Free Cash Flow Tightens at Leading Tech Firms
Several large technology companies report free cash flow under pressure despite solid net income. Capital expenditure on AI infrastructure has outpaced operating cash generation. Free cash flow for a group of major firms declined relative to earlier periods while earnings expanded. Debt markets and occasional equity issuance now help fund buildouts. Cash and short-term investments have fallen as a percentage of assets at certain firms. The traditional technology model of strong cash accumulation and buybacks is shifting.
Financial analysis highlights higher leverage and lower free-cash-flow margins. Quarterly figures show the numerical gap. Firms must balance growth ambitions against financial flexibility. Investors focus more on cash-flow metrics. Debt issuance volumes confirm the financing response. Reduced free cash flow limits capacity for shareholder returns through dividends or buybacks, altering total-return calculations for equity holders.
Data Center Builds Divert Resources From Housing and Industry
Data-center construction expands at a pace that competes with other building activity. Spending on these structures has risen while residential and non-AI commercial projects face higher costs and delays. Competition for labor, materials, and grid connections drives the reallocation. Electricity demand prompts utility investment and keeps regional power prices elevated. Land costs near major hubs have increased. Home builders report difficulty making project economics work.
Construction data document the spending divergence. Physical capacity constraints operate alongside price signals. Traditional construction-related industries see tighter margins or slower pipelines. Housing supply growth slows, and industrial facility costs rise outside the AI ecosystem. Resource competition extends into specialized trades commanding wage premiums. Electricians and facilities managers in data center markets receive notable pay increases relative to prior levels.
Equity Concentration Reaches Elevated Levels
AI-linked companies now account for a large fraction of major index capitalization and recent gains. A small number of firms contribute the majority of S&P 500 returns in some periods. This concentration amplifies the effect of AI-specific news on overall market performance. Broad index exposure delivers reduced diversification benefits. Market analysis describes the pattern as a pronounced narrowing. Market-cap shares and contribution percentages document the degree.
The pattern persisted into early October 2026. Firms outside the group need stronger absolute results to attract capital. Systemic sensitivity to a limited set of businesses rises. Historical comparisons show current levels elevated relative to prior technology cycles. Passive vehicles mechanically channel additional flows toward the largest names. Equal-weighted indexes often diverge meaningfully from capitalization-weighted benchmarks under these conditions.
Debt Markets Absorb Rising AI Issuance
Corporate bond markets have absorbed a growing share of issuance from AI-related companies. Investment-grade supply tied to hyperscalers has increased markedly. High-yield and private-credit channels expanded exposure as well. Large multi-billion-dollar deals fund data center expansion. Fixed-income analysis notes the shift in issuer composition. Year-to-date volumes and shares of total supply document the trend.
AI-related debt competes with other borrowers for investor demand. Non-AI issuers may face higher financing costs. Credit risk concentrates further in AI-linked names. Financing structures sometimes involve guarantees or special-purpose vehicles that link multiple parties. Credit spreads show greater sensitivity to AI-related developments. The rise in AI debt across investment-grade and private-credit segments adds a fixed-income dimension to capital concentration.
Power and Chip Constraints Widen Crowding-Out
Electricity and semiconductor demand create additional constraints affecting non-AI industries. Data centers consume large power volumes, prompting grid upgrades and higher regional costs. Chip demand drives shortages and price increases that impact automotive, consumer electronics, and industrial users. Component costs rise, and production schedules face delays outside the AI supply chain. Economic analysis identifies these physical bottlenecks as complementary channels.
Electricity-price trends and chip-price movements provide measurable indicators. Constraints operate independently of rates yet reinforce pressure on non-AI activity. Firms reliant on stable power or commodity chips face higher operating costs. Utility capital expenditure rises to meet new load, competing for the same resources. Semiconductor producers prioritize high-margin AI products, reducing availability for other applications and amplifying cost pressures across multiple industries.
Non-AI Earnings Growth Faces Headwinds
Companies without meaningful AI exposure confront higher capital costs, elevated input prices, and weaker relative investor interest. Earnings expansion lags the AI cohort. Higher rates increase interest expense and raise project hurdle rates. Energy and component pressures reduce margins. The absence of an AI growth narrative limits multiple expansions. Relative performance and earnings trajectories of industrial and consumer firms illustrate the gap.
Market analysis links these headwinds to AI capital absorption. Earnings-growth differentials support the connection. Pressure remains structural while AI investment stays elevated. Firms emphasize cost discipline and selective capital allocation. A persistent performance gap between AI-linked and non-AI equities continues. Internal capital-allocation decisions face higher hurdles, further slowing non-AI fixed investment formation.
Credit Concerns Appear in Rate-Sensitive Segments
Elevated rates and concentrated capital flows raise questions about credit quality in financing-dependent segments. Commercial real estate transactions have faced difficulties. Private-credit and leveraged areas receive greater scrutiny. Debt capacity absorbed by AI issuers leaves less room for other borrowers at favorable terms. Delayed or restructured commercial real estate deals provide examples. Credit-market analysis connects these developments to capital concentration.
Rate levels and deal activity support the link. Concerns remain segment-specific rather than systemic. Highly leveraged or floating-rate borrowers feel the pressure most. Credit spreads widen for non-AI names, and differentiation by quality increases. Physical resource constraints compound financing challenges for affected projects. Underwriting standards for non-AI developments have tightened in response to the combined pressures.
Portfolio Construction Adapts to Concentration
Investors face a market in which traditional sector diversification delivers less balance. Heavy AI concentration means index returns depend on a narrow set of factors. Equal-weighted approaches or deliberate non-AI allocations produce different outcomes. The trade-off involves participating in AI growth versus exposure to the broader economy. Portfolio-strategy analysis stresses understanding return sources. Contribution percentages and concentration metrics inform the assessment.
Capital diversion shapes the available opportunity set. Non-AI sectors may offer relative value if concentration moderates, yet currently operate under described headwinds. Attention to factor exposures and cash-flow quality rises. Scenario analysis must account for limited market breadth. Risk models that assume broader participation may understate AI-specific impacts. Monitoring AI capital-expenditure trends has become a market-wide indicator for portfolio managers.
Structural Questions Persist Around the AI Capital Cycle
The scale of AI capital absorption raises questions about future equity and credit market structure. Continued patterns could entrench distinctions between AI-linked and non-AI segments. Capital allocation, earnings growth, and valuations may remain bifurcated. Mean reversion remains possible if AI returns disappoint relative to capital deployed. Macroeconomic analysis frames the boom as a capital cycle with internal dynamics. Spending trajectories and financing mixes support this view.
Questions concern resource volume rather than the technology itself. Firms and investors navigate the interim period of concentration. Sharper adjustments could follow if the capital window for AI projects narrows. Free-cash-flow trends, debt volumes, and real-resource constraints serve as leading indicators. The interaction of financial and physical channels suggests effects remain visible while AI investment stays elevated relative to the rest of the economy.
🔥 Beyond the Headlines: What KuCoin 5.0 Means for You
Market news moves fast — but where you act on it matters just as much. This October, KuCoin launches KuCoin 5.0, transforming KuCoin into a rebuilt platform. Here's what actually changes for you:
One account for everything. Older platforms split your money across separate "spot," "margin," and "futures" accounts and expected you to understand why. KuCoin 5.0's unified accountremoves that entirely — deposit once, and everything is simply there (only available to VIPs for now).
Stocks, indices, and commodities. KuCoin 5.0 expands beyond crypto into global markets. When crypto chops sideways and equities rally (or the reverse), you rotate in minutes instead of opening a brokerage account and waiting days for fiat rails.
Real-world assets (RWA). Tokenized exposure to traditional assets like commodities, right inside your crypto account. One of the fastest-growing segments in global finance is no longer reserved for institutions — you access it from the same balance you trade with.
Earn while you learn. Not ready to trade? KCUSDlets your stablecoins earn daily, auto-compounding interest. The lowest-stress way to put your idle deposit to work for 4% yield.
An AI assistant in plain language. Ask questions, get market context, understand what you're looking at — built into the platform, no jargon required.
An app that doesn't overwhelm. Faster, cleaner, and consistent — intuitive from the first tap, not after a tutorial.
Safety you can check, not just trust. A MiCAR-licensed EU entity, Proof of Reserves you can verify yourself, and internationally certified security (SOC 2 Type II, ISO 27001:2022).
Create your account in minutes — and start on the platform built for where crypto is going, not where it's been.
FAQs
How has AI capital expenditure altered U.S. investment patterns in 2026?
AI-related spending has expanded far faster than other private fixed investment. Hyperscaler outlays near $780 billion contribute heavily to technology and information-processing categories. National accounts show strong equipment and data center growth, while residential and non-AI commercial investment remain flatter. Higher rates linked to AI demand further constrain alternatives. These shifts appear in economic statistics through the first three quarters of 2026.
What evidence links AI activity to higher rates for other borrowers?
Large AI infrastructure financing increases capital demand in equity and debt markets. Substantial bond issuance by hyperscalers absorbs investor capacity and influences yields. Commentary in early October 2026 connects the private AI surge to rate pressure. Rate-sensitive sectors such as commercial real estate report financing difficulties. Standard market mechanisms transmit elevated investment demand into higher borrowing costs.
Which non-technology sectors show the clearest effects?
Housing construction, traditional commercial real estate, and certain industrial categories face higher costs and tighter financing. Labor, materials, and power competition raise project expenses. Chip-price increases affect automotive and consumer-electronics producers. Earnings growth in these areas generally trails the AI cohort. Effects appear in both financial metrics and physical resource allocation.
How concentrated have equity market returns become?
A limited number of AI-exposed companies account for a large majority of recent S&P 500 gains. Market-capitalization shares of top firms stand at elevated historical levels. Breadth outside this group remains limited. Concentration amplifies the AI-related news impact on index performance. Attribution data through early October 2026 quantify the contribution percentages.
What role does debt play in funding the AI buildout?
As free cash flow tightens at several large technology firms, debt issuance rises to support capital expenditure. Hyperscalers placed substantial investment-grade volumes in 2026. Private-credit channels also expanded exposure. The shift increases leverage tied to the buildout and links credit markets more closely to AI outcomes. Deal data document the rise in volumes and issuance shares.
Disclaimer: This content is for informational purposes only and does not constitute investment advice. Investments carry risk. Please do your own research (DYOR).