

S&P 500 at Record High as VIX Hits 2026 Low: Is a Midterm-Year Stock Market Correction Coming?
2026/08/23 08:00:00
Could Low Volatility Signal a Coming Market Pullback?
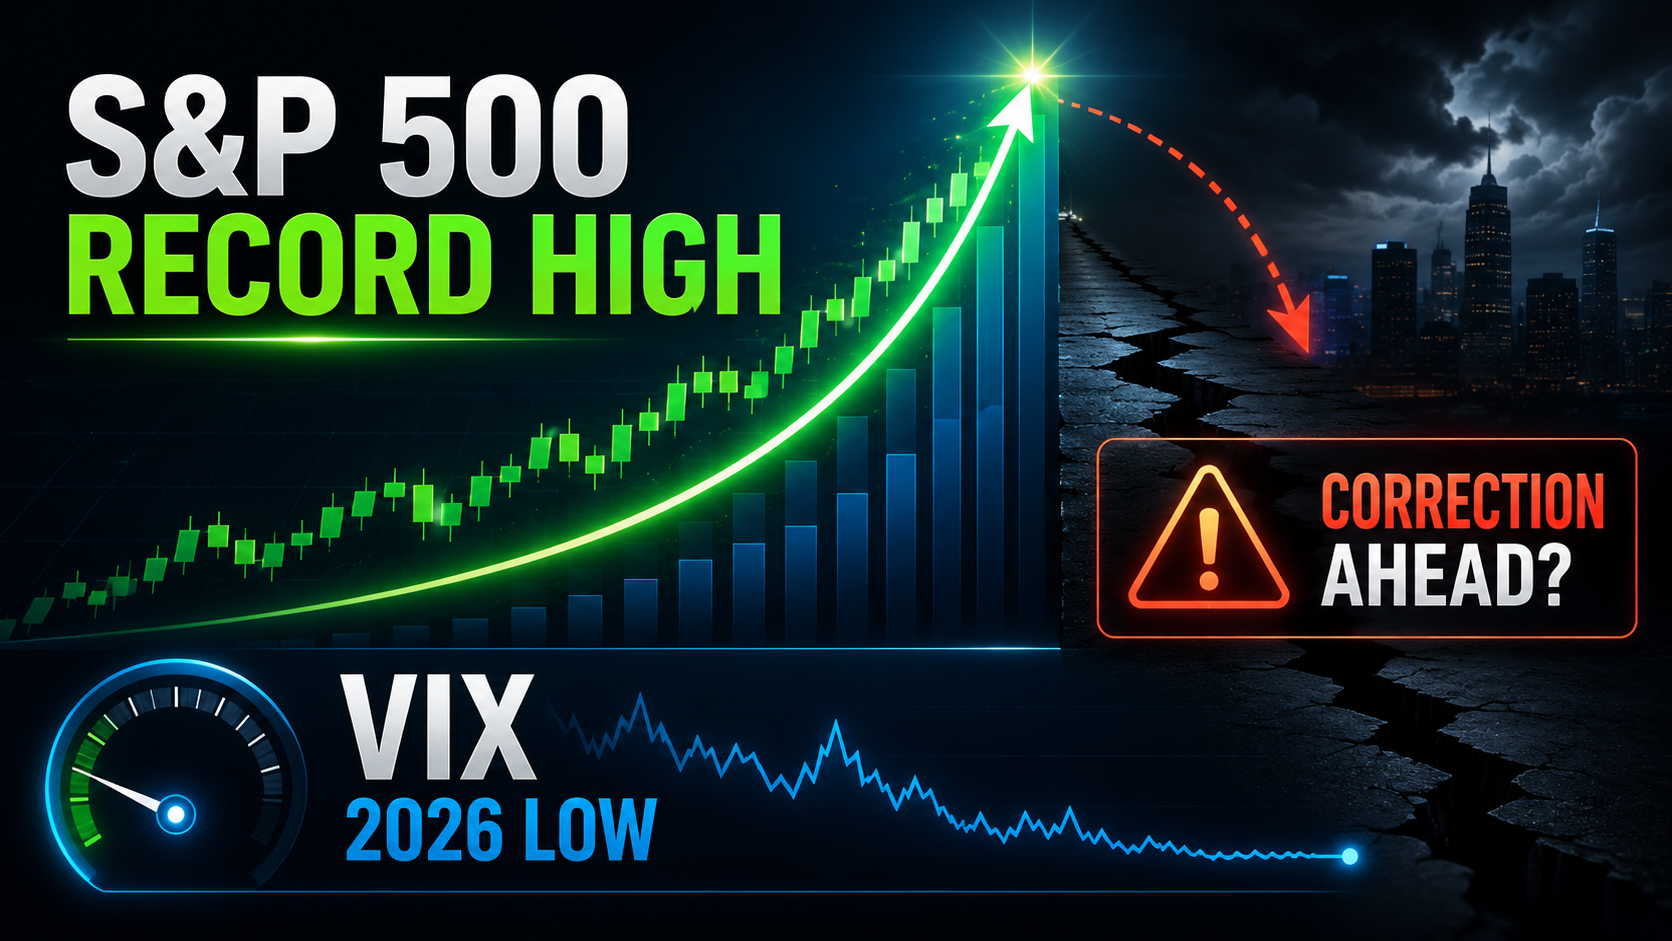
The S&P 500 achieved a remarkable milestone by closing at a new all-time high of 7,798.99 on August 13, 2026. This significant achievement marked the index's 27th record close of the year, showcasing an impressive year-to-date advance of approximately 13.4%. At the same time, the Cboe Volatility Index (VIX) has been trading near its lows for the year 2026, dipping to a low of 14.25 on August 14 before stabilizing and hovering in the mid-15 range. This intriguing combination of strong price performance and subdued implied volatility has sparked considerable debate among market analysts and investors regarding whether the market is overdue for a correction.
This concern is particularly heightened as the calendar approaches the historically weakest period of a U.S. midterm election year. While the current rally reflects the resilience of corporate earnings and a reduction in fears surrounding potential rate hikes, historical data spanning several decades of midterm election years indicates that there are elevated odds of experiencing at least a 7% drawdown in the market between mid-August and mid-October. This statistical insight warrants a careful and thorough risk assessment rather than a sense of complacency among investors.
Record Closes Accumulate as Earnings and Soft Data Fuel Gains
The S&P 500’s 27th record close of 2026 arrived after a strong weekly advance of 3.6% ending August 7, its best weekly performance since April. Closing levels climbed from approximately 7,600 in early August to the 7,798.99 peak, with the index trading above its 50-day and 200-day moving averages for extended periods. Year-to-date gains stood near 13-14% through mid-August, supported by solid second-quarter earnings reports and a softer-than-expected July jobs figure that reduced expectations of an immediate Federal Reserve rate increase. Technology and semiconductor names provided leadership, while equal-weight versions of the index also advanced, indicating broader participation beyond mega-cap stocks.
Historical context shows years reaching 27 records rarely stop there; most continue to additional highs before year-end, though August has marked the final peak only once since 1960. Investors monitoring price action note the index remains well above its March 2026 closing low near 6,343, reflecting a recovery of more than 22%. This momentum has occurred against a backdrop of moderated producer-price inflation data that further calmed rate concerns. Market participants continue to weigh these gains against valuation metrics that sit above long-term averages, creating a tension between fundamental support and technical overextension. The accumulation of records underscores the market’s ability to climb walls of worry yet also raises questions about sustainability as seasonal headwinds approach.
Soft economic releases have played a direct role in sustaining the advance. The unexpected decline in nonfarm payrolls reported in early August contributed to a risk-on environment, allowing the major averages to post consecutive weekly gains. Chipmakers and software firms extended the rally on stronger capital-spending outlooks from certain cloud providers, while energy prices fluctuated without derailing equity appetite. The index’s proximity to the 7,800 level for the first time intraday showed the speed of the move from July levels near 7,300. Analysts tracking breadth observe that advancing issues outnumbered decliners on several key sessions, supporting the notion of healthy internal strength. Yet the concentration of gains in information technology remains a point of scrutiny, as equal-weight performance has lagged on some days.
VIX Compression Signals Complacency Near Multi-Month Lows
The VIX has traded in a tight band near its 2026 trough, reaching 14.25 on August 14 and remaining below 16 for much of the surrounding period. Readings in the mid-teens sit well below the index’s long-term average near 18.6 and far under the 20-plus levels that often accompany market stress. This compression indicates that option markets are pricing relatively low expected 30-day volatility for the S&P 500, consistent with the steady grind higher in equity prices. On sessions when the S&P 500 set records, the VIX sometimes edged higher modestly yet failed to sustain any meaningful spike, reflecting limited demand for downside protection. Historical comparisons show that prolonged periods of sub-15 VIX readings have preceded both continued rallies and abrupt increases once catalysts emerge. The current low sits against a 52-week range that earlier reached above 35, illustrating how quickly sentiment can shift.
Market technicians note that the absence of hedging activity leaves portfolios more exposed should an unexpected event materialize. Data from Cboe confirms the VIX closed near 15.19 on August 17 before fluctuating around 15.7-15.8 the following day. This subdued backdrop has encouraged some strategists to recommend adding protection precisely because the cost remains relatively inexpensive. Low implied volatility often coincides with elevated equity valuations and strong momentum, creating conditions where small shocks can produce larger price responses. In the present case, the VIX’s proximity to 2026 lows occurs while the S&P 500 trades near all-time highs, amplifying the potential impact of any reversal. Option skew and term-structure data have remained relatively calm, with short-term VIX futures not showing aggressive contango or backwardation.
Investors relying solely on the fear gauge may underappreciate residual risks from geopolitical developments or shifts in monetary-policy expectations. The recent modest upticks in the VIX on softer equity sessions demonstrate that the market retains some sensitivity, yet the absolute level still signals complacency. Strategists tracking volatility surfaces observe that protective puts remain attractively priced relative to recent history, offering a practical avenue for risk management. Continued compression would require sustained economic stability and the absence of negative surprises, conditions that historical midterm patterns have often disrupted. The current reading therefore serves as both a reflection of recent calm and a potential warning of vulnerability.
Midterm Election Years Display Consistent Seasonal Weakness
U.S. midterm election years have historically produced the weakest average returns within the four-year presidential cycle. Since 1948, the S&P 500 has averaged roughly 4.6% in midterm years compared with 11.2% in the other three years combined. More relevant for the current window is the intra-year pattern: average peak-to-trough drawdowns in midterm years have reached approximately 17-19% since the mid-20th century, exceeding the 12% average seen in non-midterm years. The period from mid-August through mid-October stands out as particularly challenging. Research covering cycles since 1990 shows that the equal-weight S&P 500 experienced at least a 7% correction between August and October in the large majority of midterm years.
Exceptions such as 2006 still saw earlier declines that effectively front-loaded the adjustment. These patterns hold across different economic regimes and policy environments, suggesting a structural tendency rather than isolated coincidence. Political uncertainty surrounding congressional control frequently contributes to reduced risk appetite among institutional investors during this stretch. The current cycle enters the window with the index already at elevated levels, raising the stakes for any seasonal pressure. Data compiled by multiple market strategists reinforce the consistency of the August-October softness. In cycles from 1990 onward, corrections of 7% or more appeared in 1990, 1998, 2002, 2010, 2014, 2018, and 2022 during that window. The average drawdown from mid-August to Election Day across a longer sample reached about 8%.
Bottoms have often formed in late September or October, after which markets have frequently recovered. This year has so far diverged from the typical early-year weakness, posting solid gains instead, yet the calendar still points to the same vulnerable stretch. Analysts emphasize that the midterm effect is not a mechanical forecast but a statistical tendency that has repeated across decades. Investors examining the full presidential cycle note that the year following midterms has often delivered above-average returns once clarity improves. The present environment therefore invites a balanced view that acknowledges both the historical odds of a pullback and the potential for a subsequent rebound.
BTIG and Other Strategists Highlight Elevated Near-Term Risks
BTIG’s technical strategists have explicitly flagged the current period as historically the weakest stretch of a midterm year. Their analysis notes that valuations remain elevated while volatility sits near 2026 lows, creating an asymmetric risk profile. The firm recommended reducing equity exposure or implementing hedges as the market enters the August-to-October window. Supporting data show that since 1990 the S&P 500 has recorded corrections of at least 7% between roughly August 18 and October 11 in nearly every midterm cycle, with only limited exceptions. Sector observations within the note highlight relative resilience in healthcare and technical weakness developing in semiconductors.
These comments arrive after the index has already logged multiple records and a double-digit year-to-date advance, amplifying the contrast between recent performance and seasonal history. Other research houses have echoed similar caution regarding the midterm calendar without predicting an exact magnitude of decline. The consensus among these technical observers centers on the attractiveness of adding protection while implied volatility remains compressed. The practical implication of these warnings is a call for proactive risk management rather than outright liquidation. Strategists point out that many prior midterm corrections were triggered by unforeseen external events, geopolitical, financial, or health-related, rather than the election itself. Current conditions of high valuations and low hedging demand leave the market more susceptible to such surprises.
Healthcare’s historical relative strength during these windows offers one potential area of focus for selective exposure. Semiconductor technical signals, by contrast, suggest caution around recent leadership groups. Investors can evaluate their own portfolio beta and concentration against these observations. The timing of the BTIG note, issued as the calendar crossed mid-August, aligns precisely with the start of the documented soft period. While no single research call determines market direction, the alignment of multiple historical datasets with present valuations and volatility levels strengthens the case for heightened vigilance.
Valuation Levels Sit Above Historical Norms at Cycle Highs
Forward price-to-earnings multiples for the S&P 500 have expanded alongside the recent advance, placing the index above its long-term average valuation. The combination of elevated multiples and record price levels increases the potential magnitude of any correction should earnings expectations or discount rates shift. Year-to-date performance near 13-14% has outpaced many earlier midterm years, leaving less margin for disappointment. Analysts tracking valuation dispersion note that concentration in a handful of large technology names continues to influence aggregate metrics. Equal-weight valuations, while still elevated, provide a partial check on mega-cap influence.
Historical episodes in which the market reached new highs with above-average multiples often experienced mean-reverting pullbacks, though timing varied widely. Current conditions therefore incorporate both fundamental support from earnings growth and technical vulnerability from stretched pricing. Investors assessing risk-reward must weigh the probability of continued multiple expansion against the seasonal and cycle-based headwinds. The absence of extreme valuation extremes seen in prior bubbles does not eliminate the possibility of a normal 7-10% correction. Supporting context comes from the index’s recovery journey. From its March 2026 low near 6,343, the S&P 500 has advanced more than 22%, compressing the time frame in which valuations have expanded. Corporate earnings growth has helped justify a portion of the re-rating, yet the speed of the move leaves limited cushion.
Market participants monitoring free-cash-flow yields and other cash-flow metrics observe that these too have moderated from more attractive levels earlier in the cycle. The interaction between valuation and low volatility creates a feedback loop in which rising prices further suppress the VIX, encouraging additional buying. Breaking that loop typically requires either a catalyst or a gradual shift in positioning. For portfolio construction, the current setup argues for disciplined position sizing and attention to downside scenarios consistent with midterm history. Valuation alone rarely times markets, yet it remains a critical input when layered with seasonal and cycle data.
August-October Window Carries the Highest Historical Drawdown Odds
Statistical reviews of midterm years identify the August-to-October interval as the period of greatest average weakness. Across multiple decades, the equal-weight S&P 500 has delivered negative or near-flat returns during this stretch more frequently than in other three-month windows. Peak-to-trough declines of 7% or greater have materialized in the large majority of cycles since 1990. The average mid-August-to-Election-Day drawdown has measured approximately 8% in longer samples. Bottoms have clustered in late September or October in many instances, after which markets have often staged strong recoveries into year-end and the following year.
This year the index enters the window already near all-time highs and with the VIX near cycle lows, potentially magnifying the impact of any selling pressure. External catalysts have frequently coincided with these seasonal soft patches, ranging from geopolitical events to financial stresses. The consistency of the pattern across different interest-rate and growth regimes suggests it is not solely a function of contemporary policy. Investors can use the historical distribution of outcomes to frame scenario planning. A 7% correction from the recent 7,799 peak would bring the index near 7,250, a level that remains well above the March low and consistent with prior midterm adjustments.
Larger drawdowns have occurred but are less frequent. The post-bottom recovery has historically been robust, with the twelve months following midterm elections averaging double-digit gains in many studies. Positioning, therefore, benefits from distinguishing between tactical risk reduction and longer-term strategic allocation. Monitoring daily breadth, volume, and sector rotation during the window can provide real-time confirmation or contradiction of the seasonal tendency. The current low-volatility environment means that any increase in realized volatility could itself become a reinforcing factor for further selling. Awareness of the calendar does not require predictive certainty; it simply informs probability-weighted decision-making.
Corporate Earnings Resilience Offsets Some Seasonal Pressure
Second-quarter earnings season delivered solid results that helped propel the S&P 500 to new highs. Many large-capitalization companies reported revenue and profit growth that exceeded consensus estimates, particularly within technology and communication services. Guidance updates from certain firms regarding capital expenditure and AI-related spending reinforced confidence in medium-term growth trajectories. The soft July employment report further supported equity prices by reducing the perceived likelihood of aggressive monetary tightening. These fundamental inputs have allowed the market to absorb modest increases in geopolitical tension and fluctuating energy prices without sustained damage.
Earnings breadth has improved relative to earlier periods of the cycle, although concentration among the largest constituents remains notable. The quality of reported results provides a buffer against purely seasonal selling pressure. Yet history shows that even strong earnings environments have not always prevented midterm corrections when political uncertainty or external shocks intervened. Looking ahead, the focus shifts to third-quarter results and any revisions to full-year guidance. Sustained earnings growth would help justify current valuations and potentially limit the depth of any pullback. Conversely, signs of slowing demand or margin pressure could interact with seasonal weakness to produce a sharper adjustment.
Analysts tracking estimate revisions note that upward momentum has been present but is not uniform across all sectors. The interaction between earnings delivery and the midterm calendar therefore remains a key variable. Investors can emphasize companies with clear visibility into cash-flow generation and conservative balance sheets as a partial hedge against broader market volatility. The fundamental backdrop is constructive, yet it does not eliminate the statistical tendency for price weakness in the current seasonal window. Balancing earnings optimism with historical pattern recognition offers a more complete framework for decision-making.
Geopolitical and Macro Factors Add Uncertainty Layers
Continued developments in the Middle East and fluctuations in oil prices have introduced episodic volatility without derailing the equity advance. Sessions featuring rising energy costs have occasionally pressured consumer-related and industrial names, yet broader indices have recovered quickly. Trade-related discussions between major economies continue in the background, contributing to an undercurrent of policy uncertainty. These external factors sit alongside domestic political developments as the midterm campaign intensifies. Historical midterm corrections have often coincided with such external catalysts rather than pure election-related selling.
The current low VIX reading implies that option markets are not heavily pricing these risks, creating potential for rapid repricing should events escalate. Macro data beyond employment, producer prices, retail sales, and inflation gauges will remain influential in shaping rate expectations and risk appetite. The combination of elevated equity levels and compressed volatility leaves limited room for negative surprises. Investors assessing the full risk landscape must integrate these macro and geopolitical inputs with the seasonal calendar. A stable resolution of external tensions would support continued equity resilience, while any deterioration could accelerate the historical midterm pattern.
Monetary-policy expectations remain data-dependent, with markets currently assigning low odds to near-term rate increases. Shifts in that probability distribution could influence discount rates and valuation multiples. Sector rotation may intensify if energy prices or policy signals change abruptly. Maintaining awareness of these overlapping risks allows for more adaptive portfolio management. The absence of extreme stress in current pricing does not preclude the emergence of stress; it merely indicates that the market is not yet prepared for it. Layering scenario analysis across these dimensions strengthens the overall analytical framework.
Sector Rotation Patterns in Prior Midterm Windows
Historical sector performance during midterm August-October periods shows relative strength in defensive areas such as healthcare and relative weakness in more cyclical or high-valuation groups. Semiconductors have displayed technical deterioration in recent sessions according to some technical strategists, consistent with leadership fatigue after strong advances. Equal-weight indices have at times outperformed cap-weighted versions during corrections, reflecting a shift away from concentrated mega-cap exposure. Energy and materials have shown mixed results depending on commodity-price trends.
These patterns provide a map for potential relative-value opportunities should a broader correction materialize. Current leadership remains skewed toward technology, leaving open the possibility of mean reversion if risk appetite fades. Healthcare’s historical resilience offers one area for selective attention, while careful monitoring of semiconductor price action can signal broader risk-off shifts. Portfolio construction can incorporate these historical tendencies without requiring precise forecasts. Reducing concentration in recent winners and maintaining exposure to sectors with defensive characteristics can improve resilience.
Breadth indicators that track the percentage of stocks above key moving averages offer real-time confirmation of rotation. Volume patterns during any decline can distinguish between orderly profit-taking and forced selling. The current environment of low volatility may delay visible rotation until a catalyst appears. Once underway, historical midterm windows have often featured accelerated moves as positioning adjusts. Awareness of these sector dynamics complements the broader index-level analysis and supports more granular decision-making.
Practical Risk-Management Approaches Amid Elevated Levels
With the S&P 500 near records and the VIX near cycle lows, the cost of downside protection remains relatively modest. Put options or collars on broad equity exposure can limit potential losses while allowing continued participation in any further upside. Reducing overall equity beta through partial reallocation to cash or shorter-duration fixed income provides another lever. Position sizing that accounts for the historical midterm drawdown distribution helps maintain portfolio integrity across scenarios. Monitoring key technical levels, such as the 50-day moving average or recent swing lows, offers objective signals for adjusting exposure. Diversification across factors and geographies can further mute the impact of a U.S.-centric seasonal pattern. These tools do not eliminate risk; they merely manage its consequences. The current pricing of volatility makes the implementation of hedges more cost-effective than during periods of elevated fear.
Investors should calibrate these approaches to their own time horizons and risk tolerances. Short-term traders may emphasize tactical hedges timed to the August-October window, while longer-term allocators may view any correction as an opportunity to add exposure at more attractive levels. Rebalancing discipline that systematically trims winners and adds to underperformers can counteract the momentum bias inherent in recent markets. Scenario analysis that incorporates both a 7% midterm-style correction and a continued grind higher helps quantify potential outcomes. Documentation of decision rules in advance reduces the influence of emotion once volatility rises. The combination of historical pattern recognition and practical risk tools provides a structured response to the present setup.
Post-Midterm Recovery Patterns Offer Longer-Term Context
While the near-term window carries elevated correction odds, the historical record after midterm elections is more constructive. The twelve months following midterm elections have delivered average S&P 500 gains in the low-to-mid teens across multiple decades, with a high percentage of positive outcomes. The fourth quarter of midterm years itself has often been strong, averaging gains near 7% in some samples. These recovery patterns reflect the resolution of political uncertainty and a renewed focus on economic fundamentals. The current cycle’s strong year-to-date performance may alter the magnitude of any post-election rebound, yet the directional tendency remains relevant. Investors with multi-year horizons can view potential near-term weakness as part of a larger cycle rather than an endpoint. Maintaining strategic equity exposure while managing tactical risk aligns with this longer-term evidence.
The consistency of the post-midterm rally across different policy and growth regimes strengthens its informational value. Even cycles that experienced deep intra-year drawdowns frequently recovered to finish higher or deliver solid subsequent returns. This asymmetry, elevated near-term risk followed by historically favorable medium-term returns, shapes an optimal response of measured caution rather than extreme pessimism or exuberance. Tracking the evolution of congressional polling and legislative agendas can provide incremental signals as Election Day approaches. Ultimately, the interplay between seasonal weakness and post-election recovery underscores the importance of time-horizon alignment in investment decisions.
Balancing Historical Odds Against Current Fundamentals
The tension between midterm seasonal patterns and present-day earnings strength defines the current investment landscape. Historical data assign meaningful probability to a 7% or greater correction in the weeks ahead, particularly given elevated valuations and compressed volatility. Simultaneously, corporate results and moderating inflation data supply fundamental support that has already produced multiple record closes. Neither factor operates in isolation; their interaction will determine the path of prices. Investors who integrate both perspectives avoid the extremes of dismissing history or ignoring fundamentals. Continuous monitoring of breadth, volatility, and earnings revisions supplies the real-time information needed to update probabilities. The market’s ability to climb on soft data and strong reports demonstrates resilience, yet resilience does not equate to immunity from seasonal forces. A disciplined framework that respects both datasets positions portfolios for a range of outcomes.
In practice, this balance translates into maintaining core exposure while incorporating tactical hedges or reduced beta during the documented soft window. The low absolute level of the VIX currently facilitates such adjustments at reasonable cost. Should the historical pattern assert itself, the subsequent recovery phase has often rewarded patient capital. Should the market instead extend its advance, the same framework allows participation without excessive leverage. The absence of certainty is inherent; the presence of structured analysis is the available advantage. As the calendar advances through the remainder of August and into the autumn, the interplay of these forces will continue to shape equity returns.
FAQs
How significant is the current VIX level relative to historical midterm years?
The VIX near 14-16 sits at the low end of its 2026 range and well below its long-term average near 18.6. In prior midterm years, volatility often rose during the August-October window as corrections unfolded. The present compression means protection is relatively inexpensive, yet it also indicates limited pricing of downside risk. Investors comparing across cycles note that sub-15 readings have preceded both extended calm and sharp spikes once catalysts appeared. Current levels therefore show both opportunity for cost-effective hedging and potential vulnerability to rapid repricing.
What magnitude of correction has been typical in midterm August-October periods?
Since 1990, the equal-weight S&P 500 has experienced at least a 7% peak-to-trough decline between August and October in the large majority of midterm years. Average drawdowns from mid-August to Election Day have measured around 8% in longer samples. Some cycles saw deeper declines, while a few experienced the adjustment earlier in the year. These figures provide a statistical reference rather than a precise forecast for 2026.
Do strong earnings typically prevent midterm corrections?
Earnings strength has supported the current advance and can limit the depth of any pullback, yet historical midterm windows have produced corrections even during periods of solid corporate results. External catalysts and political uncertainty have often overridden fundamental support temporarily. The quality of the latest earnings season is constructive, but it does not eliminate the seasonal tendency documented across decades.
Which sectors have shown relative resilience during past midterm soft periods?
Healthcare has historically displayed relative strength during midterm August-October windows, while more cyclical or high-valuation groups have sometimes lagged. Semiconductors have recently exhibited technical weakness according to some strategists. These patterns can inform selective positioning but should be combined with current fundamental and technical analysis.
How have markets performed in the twelve months after midterm elections?
The twelve months following midterm elections have delivered average S&P 500 gains in the low-to-mid teens across multiple decades, with a high success rate of positive returns. The fourth quarter of midterm years itself has often been among the stronger periods in the presidential cycle. This recovery pattern provides longer-term context for any near-term weakness.
Is the current year following the typical midterm script so far?
2026 has diverged from the typical early-year weakness of many midterm cycles by posting solid gains and multiple record highs. The calendar, however, still points to the same historically soft August-October window. The combination of elevated levels and low volatility may amplify the impact should seasonal pressure emerge.
🔥 KuCoin Offers A More Stable Option in A Volatile Market
If you worry about the frequent ups and downs in the market, and pursue a more stable option to earn money passively, KuCoin is the right place to come:

Kucoin Earn: Earn stable profits with professional asset management.
Hold to Earn: Earn rewards by holding assets in Funding, Trading, Margin, Futures, Mining, and Unified Accounts.
Staking: Unlock the earning potential of on-chain assets.
Advanced Investments: Advanced Investments offer a variety of structured products to help your money grow in any market.
Shark Fin: Principal Protection and Guaranteed Gains
Dual Investment: Buy low and sell high with transparent return calculations.
Snowball: High yields, with price protection.
Discount Buy: Buy crypto at discount prices.
KCS Loyalty: Level up to enjoy exclusive perks by staking ≥ 1 KCS.
KuCoin Wealth: Discover future value and begin your smart investing journey.
KCS Benefits: Hold and stake KCS to access benefits across the platform.
KCS Staking 2.0: Participate in KCS on-chain governance to earn yield.
Disclaimer: This content is for informational purposes only and does not constitute investment advice. Cryptocurrency investments carry risk. Please do your own research (DYOR).