

Bitcoin SOPR Breaks Above 1 for the First Time in Over a Year — Bullish Signal from Short-Term Holders
On-Chain Data Signals a Shift From Capitulation to Profit-Taking
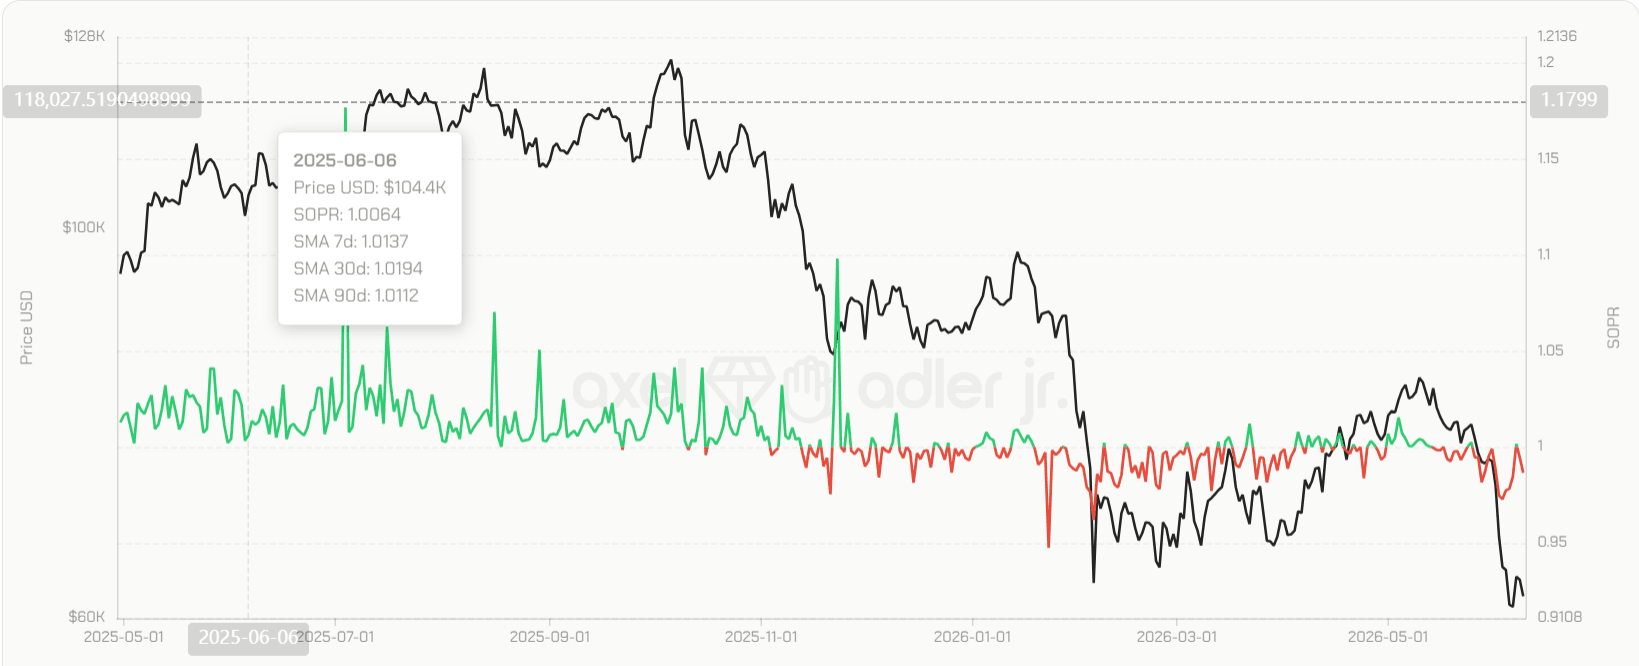
Bitcoin’s short-term holder Spent Output Profit Ratio (SOPR) has notably moved above the critical break-even level of 1, reaching an approximate value of 1.01. This significant development marks the first sustained entry into positive territory for this specific cohort of market participants in over twelve months, indicating a noteworthy shift in market dynamics. The information, highlighted by comprehensive on-chain analytics from CryptoQuant, arrives at a time when the asset is trading within the range of $79,000 to $81,000. This price range reflects a measurable and observable shift in the behavior of recent market participants, suggesting a change in sentiment. Short-term holders, who are defined as those individuals controlling coins that have been held for less than roughly six months or 155 days, depending on the exact cohort filter applied, had spent an extended period realizing losses on average.
Their return to a state of modest profitability significantly alters the character of selling pressure in the market and provides a valuable data-driven reference point for assessing whether the broader market structure is in the process of transitioning. The idea is clear and compelling: the reclaiming of the 1.0 threshold by the short-term holder SOPR represents an early but constructive on-chain signal. This signal indicates that active participants in the market have moved from a phase characterized by capitulation-style loss realization into a new phase of measured profit-taking. This pattern of behavior has historically accompanied the early stages of more durable upward trends when sustained over time, suggesting a potential shift in market momentum that could lead to further positive developments in the future.
Short-Term Holder SOPR Crosses Key Threshold After Extended Losses
The Spent Output Profit Ratio calculates the ratio of the realized value of spent Bitcoin outputs to the value of those same outputs at the time they were last moved. A reading above 1 indicates that, on average, coins being transacted are sold at a profit relative to their acquisition cost; a reading below 1 shows average loss realization. For the short-term holder subset, the metric isolates more recent entrants whose cost basis sits closer to current market prices and who therefore respond more quickly to price swings. According to reporting based on CryptoQuant data published in early September 2026, this short-term holder SOPR climbed above 1 and settled near 1.01. That level is the first clear break into positive territory after a prolonged stretch during which the same cohort remained underwater. The prior extended period of average losses lasted roughly a full year, consistent with the depth and duration of the drawdown that followed the October 2025 peak near $120,000–$126,000.
The recent reclaim therefore stands out as a behavioral inflection rather than a minor fluctuation. Price at the time of the reading hovered in the high $70,000s to low $80,000s, meaning short-term holders who entered during earlier phases of the recovery or during the subsequent consolidation were finally able to exit without locking in losses on average. This change reduces one source of forced or reluctant selling and simultaneously demonstrates that the most reactive portion of the market has regained a modest cushion. The metric’s sensitivity makes it useful for shorter-term regime assessment, and the fact that it has now cleared the psychological and mathematical break-even line after such a long interval supplies concrete evidence of improving conditions among active participants.
STH-SOPR Reclaims 1 as Capitulation Pressure Begins to Ease
Market observers note that short-term holders form the most liquid and sentiment-sensitive segment of the Bitcoin supply. Their collective decision to sell only when in slight profit rather than at a loss alters the daily flow of coins onto exchanges and into secondary markets. When the ratio sits below 1 for months, every incremental price decline tends to generate additional loss-taking volume that can reinforce downward momentum. Once the ratio stabilizes above 1, that feedback loop weakens. The current reading of approximately 1.01 is modest rather than exuberant, which is itself constructive; extreme readings well above 1 have in past cycles coincided with late-stage distribution.
A reading just above break-even suggests that profit-taking is occurring in a measured fashion rather than in a wave of aggressive selling. Supporting data from the same period show that overall SOPR also hovered near or slightly above 1, reinforcing that the broader spent-output picture has improved. The combination of a year-long sub-1 regime followed by a decisive reclaim supplies a clear before-and-after contrast that traders and analysts can use to frame subsequent price action. As long as the short-term holder cohort continues to realize modest gains on average, the probability of renewed capitulation-driven selling diminishes, allowing other demand sources more room to operate.
CryptoQuant Data Highlights First Profit Zone Entry in 12 Months
CryptoQuant analyst Darkfost publicly noted the development in early September 2026, stating that short-term holder SOPR had risen above 1 to roughly 1.01 and that this constituted the first move into the profit zone in more than a year. The observation was subsequently carried by multiple market data aggregators and news outlets. The analyst emphasized that the prior bear-market stretch left short-term holders in an average-loss state for approximately twelve months, making the current reading meaningfully stronger than a brief reaction observed in May of the same year. In May, the metric had approached or briefly tested positive territory before retreating, an episode that proved temporary.
The September reading, by contrast, arrives after a more extended period of price stabilization and recovery from the mid-year lows near the high $50,000s to low $60,000s. Darkfost further observed that a healthy market environment is characterized not by the absence of profit-taking but by consistent, moderate realization of gains, particularly from the most active cohort. The current level satisfies that description. Historical context supplied in the same commentary notes that sustained periods of short-term holder profit realization have accompanied prior bull-market phases. The data therefore supply both a real-time reading and a comparative benchmark against the preceding year of losses and against the weaker May bounce.
Profitability Metrics Point to Improving Market Momentum
Verification of the underlying numbers comes from the same on-chain analytics platform that tracks spent-output profitability across cohorts. The short-term holder filter typically captures coins younger than 155 days or six months, isolating participants whose holding period is short enough that their average cost basis remains sensitive to recent price ranges. When that group moves from consistent loss realization to slight profit realization, the change is visible in the aggregate ratio within a relatively short observation window. The fact that the ratio has now cleared 1 and is being discussed as a multi-month first supports the claim of structural improvement rather than noise.
Complementary metrics such as the seven-day and thirty-day moving averages of the same series help distinguish a one-day spike from a more durable shift; early commentary already flagged the importance of the thirty-day average remaining elevated. Price context at the time of the reports placed Bitcoin near $79,800, a level that had been contested multiple times in the preceding weeks. The alignment of an on-chain profitability threshold with a visible price range gives the signal additional practical relevance for participants monitoring both order-book dynamics and blockchain data.
Historical Parallels to Prior Cycle Transitions
Previous Bitcoin market cycles contain multiple instances in which short-term holder SOPR spent extended periods below 1 before reclaiming the threshold and holding it. One frequently cited parallel is the period surrounding the 2022–2023 transition. After the deep losses associated with the 2022 bear market, short-term holders remained underwater for a prolonged interval; once their SOPR reclaimed and then defended the 1.0 level, subsequent price action trended higher over multi-month horizons. Similar patterns appeared after other major capitulation phases in earlier cycles. The common sequence involves an initial wave of loss realization that exhausts the most stressed sellers, followed by a gradual return to break-even and then modest profitability as new demand absorbs remaining supply.
The 2025–2026 episode followed an analogous path: an October 2025 peak near all-time highs, a multi-month decline that took the price roughly halfway lower at the July lows, and a subsequent recovery that allowed short-term cost bases to move back into slight profit. The eleven-month stretch of suppressed SOPR readings documented by CryptoQuant contributors further underscores the duration of the prior regime. Analysts examining the current data set note that the depth of the preceding loss-realization phase strengthens the significance of the reclaim. When short-term holders have already absorbed substantial mark-to-market losses and still choose to sell only once they regain a small positive margin, the implication is that remaining supply is less desperate.
Bitcoin’s Latest On-Chain Signal Points to an Early Recovery Phase
Historical recovery periods after similar multi-month sub-1 regimes have often featured declining realized losses, rising average holding periods among the residual short-term cohort, and gradual improvement in related profitability gauges such as short-term holder MVRV. The present reading near 1.01 sits in a zone that past cycles treated as an early constructive signal rather than a late-cycle overheating marker.
Of course, no single metric guarantees future price direction; the value of the parallel lies in the repeated sequence of prolonged loss realization followed by a decisive return above break-even. Market participants who track on-chain data therefore treat the September 2026 crossing as consistent with the early phase of prior transitions rather than an isolated anomaly.
Role of Active Market Participants in Sustaining Momentum
Short-term holders constitute the portion of Bitcoin supply that turns over most frequently, and that responds most directly to near-term price and sentiment shifts. Their collective behavior therefore exerts outsized influence on daily and weekly realized profit-and-loss flows. When this group sells predominantly at a loss, the market experiences continuous pressure from participants seeking to exit underwater positions. Once the same group begins selling only after recovering a small profit, that pressure eases, and the coins that do move tend to transfer into the hands of buyers who are willing to pay current market levels. The recent move of short-term holder SOPR above 1 indicates that this transition is under way. Supporting commentary from on-chain researchers stresses that moderate, consistent profit realization by active holders is a feature of healthier market phases rather than a warning sign. Extreme profit-taking spikes can coincide with local tops, but a reading only modestly above 1 after a long period below 1 is more consistent with the rebuilding of confidence among the reactive cohort.
The practical consequence is a change in the character of supply available on exchanges and in over-the-counter channels. Coins that previously moved because holders needed to crystallize losses now move because holders choose to lock in small gains. That distinction matters for assessing the sustainability of any price advance. If short-term holders continue to realize modest profits while longer-term holders remain relatively inactive or only selectively distribute, the overall spent-output picture remains constructive. Data from the same September window show long-term holder SOPR readings that were also near or above break-even in some snapshots, suggesting that older coins were not flooding the market at large losses. The combination leaves room for demand from both new entrants and existing holders to support price without immediate heavy distribution from the most sensitive cohort.
Comparing Current Reading to May 2026 Temporary Rebound
In May 2026, the short-term holder SOPR approached or briefly exceeded the 1.0 level before retreating, an episode that proved insufficient to mark a lasting regime change. Price at that time was also testing levels near the high $70,000s to low $80,000s, yet the on-chain profitability signal failed to hold. The September reading is distinguished by both the longer preceding period of losses and the clearer separation from the earlier false start. Analysts covering the latest data explicitly noted that the current level sits meaningfully higher than the May reaction and arrives after a more complete absorption of prior selling pressure. The intervening months included further price weakness into the mid-year lows, followed by a recovery that reset many short-term cost bases lower, making the subsequent reclaim more robust.
The difference in context also appears in related metrics. By September the market had already experienced multiple tests of support in the $60,000–$70,000 region and had begun to stabilize higher. Short-term holders realized price estimates had declined from earlier peaks, so a return of spot price into the same nominal range left a larger share of recent buyers in profit. The May episode lacked that extended base-building phase. Consequently, the September crossing carries greater weight as a potential regime marker. Continued observation of the thirty-day moving average will determine whether the latest reading evolves into the sustained positive zone that characterized earlier bull-market transitions or whether it proves as fleeting as the May attempt.
Importance of the 30-Day Moving Average Holding Above Break-Even
A single daily or multi-day print above 1 can be reversed by a subsequent bout of volatility. The thirty-day moving average of short-term holder SOPR therefore receives particular attention as a smoother gauge of whether the shift is taking root. Commentary accompanying the September data emphasized that if this longer-window average can remain at or near the newly positive levels, the signal would gain substantial credibility. Historical bull-market phases have featured extended intervals in which short-term holders consistently realized profits, keeping both the raw series and its moving averages above 1 for weeks or months. A durable thirty-day average above break-even would indicate that profit-taking has become the norm rather than the exception for the active cohort.
The practical monitoring implication is straightforward. Traders and analysts can track the thirty-day series alongside the raw daily values and price action. If the average begins to roll over and head back toward or below 1 while price stagnates or declines, the constructive interpretation would need revision. If the average holds and gradually rises, the probability increases that short-term selling pressure remains contained. Because short-term holders turn over supply more rapidly than long-term holders, their moving-average behavior also serves as an early warning or confirmation layer for broader market structure. The September reports treated the potential persistence of the thirty-day average in positive territory as one of the clearest near-term confirmatory conditions for the emerging signal.
Interaction Between Short-Term and Long-Term Holder Metrics
Short-term and long-term holder SOPR series often move with different amplitudes and at different stages of a cycle. Short-term readings oscillate more frequently around 1 because recent cost bases are closer to spot. Long-term readings tend to remain elevated for longer once a bull market is established and to decline more slowly during corrections. In the period surrounding the September 2026 short-term reclaim, available snapshots showed long-term holder SOPR also near or modestly above 1 in some data sets, indicating that older coins were not being spent at deep losses. That alignment reduces the risk of a simultaneous capitulation across both cohorts. Earlier in the cycle, particularly around the late-2025 and early-2026 lows, both series had printed sub-1 readings at various points, consistent with broader stress.
The current configuration, short-term holders back in slight profit while long-term holders remain roughly neutral to modestly profitable, supports a narrative of improving conditions without evidence of aggressive late-cycle distribution by the most seasoned holders. When long-term SOPR rises sharply above 2 or 3, historical cycles have often entered distribution phases. Readings near 1 leave substantial room before that threshold is approached. The interaction therefore currently favors a constructive reading: the reactive cohort has stopped bleeding, and the patient cohort has not yet begun large-scale profit realization. Continued divergence or convergence between the two series will supply additional information as the market evolves.
Market Price Action Around the $80,000 Level Amid On-Chain Shifts
Bitcoin price during the first week of September 2026 traded in a range that repeatedly tested and briefly exceeded the $80,000–$82,000 zone. Spot levels near $79,800 at the time of the primary SOPR reports placed the asset in a region that had served as both resistance and support at different points earlier in the year. The concurrent improvement in short-term holder profitability means that many participants who bought during the preceding recovery or consolidation phases now sit at or above their cost basis when price reaches these levels. That alignment reduces the incentive for immediate loss-driven selling into any further upside.
Price discovery in this region therefore occurs against a backdrop of diminished forced supply from the short-term cohort. Order-book and on-chain flow data from the same window showed that advances were met with measured rather than panicked selling, consistent with the modest SOPR readings just above 1. Participants monitoring both Bitcoin price charts and on-chain profitability metrics could observe the interaction in real time: each push toward the upper end of the recent range occurred with short-term holders realizing small gains rather than locking in losses. The result is a more orderly supply profile than the one that characterized the deeper phases of the prior drawdown.
Broader On-Chain Profitability Trends Supporting the Signal
Beyond the short-term holder SOPR itself, related profitability gauges painted a compatible picture in early September 2026. Overall SOPR readings hovered near or slightly above 1, and various realized-price and MVRV-style metrics for the short-term cohort showed improvement relative to the mid-year lows. The percentage of circulating supply held in profit had risen from the more depressed levels of the preceding months, although it remained well below the extreme readings typical of late-cycle peaks. These supporting indicators reduce the chance that the short-term SOPR reclaim is an isolated data-point anomaly.
Collectively, the suite of metrics indicates that the market has moved away from the deep-loss-realization regime that dominated much of the prior year. The transition is still early; many longer-term cost bases remain elevated relative to the current spot, and absolute profit margins for the short-term cohort are still thin. The direction of travel, however, is clear: average spent outputs are no longer being realized at a loss. That directional change supplies a factual foundation for assessing subsequent developments in both price and on-chain behavior.
Results for Reduced Selling Pressure Going Forward
When short-term holders sell only after recovering a small profit, the volume of coins that must be absorbed by new buyers declines relative to a pure loss-realization environment. The practical effect is a lighter daily supply overhang from the most active segment of the market. If this condition persists, price advances face less immediate resistance from participants who are simply trying to exit underwater positions. The September data therefore carry a direct implication for the balance of flows: selling that does occur is more discretionary and less forced.
Reduced forced selling does not by itself guarantee higher prices; demand must still be present. It does, however, lower the volume of coins that need to be matched on the buy side for any given price level to hold or advance. In previous cycle transitions, the combination of exhausted short-term loss realization and the subsequent return to modest profitability often coincided with a gradual improvement in the overall supply-demand balance. The current reading places the market in a similar early-stage posture. Monitoring exchange net flows, futures open interest, and continued SOPR behavior will show whether the lighter selling pressure translates into more durable upside or remains confined to a trading range.
How Sustained Profit Realization Differs from Capitulation Phases
Capitulation phases are characterized by SOPR readings that remain well below 1 for extended periods, often accompanied by elevated realized losses and spikes in short-term holder supply moving onto exchanges. The market in those intervals experiences continuous pressure from participants who prefer to crystallize losses rather than wait for recovery. Sustained profit realization, by contrast, features readings that stay above 1, with coins moving because holders choose to lock in gains. The September 2026 transition marks the shift from the former regime to the early stages of the latter.
The behavioral distinction is important. In capitulation, selling can accelerate on further price weakness because more holders fall into deeper losses. In a modest profit-realization regime, further weakness may still produce some selling, yet the average seller is no longer underwater and therefore has less urgency. The current short-term holder SOPR near 1.01 sits at the beginning of that second regime. Whether it develops into a multi-month stretch of consistent readings above 1 will determine how fully the market leaves the prior capitulation dynamics behind. Historical episodes show that the transition itself is often the highest-signal moment; once the new regime is established, the metric’s incremental information content declines until the next major cycle turn.
Potential Confirmation Signals Traders Are Monitoring Closely
Market participants tracking the short-term holder SOPR reclaim are watching several related conditions for confirmation or invalidation. The most immediate is the behavior of the thirty-day moving average: a sustained reading above 1 would strengthen the constructive case. Secondary checks include the persistence of overall SOPR above break-even, the absence of a sharp spike in long-term holder distribution, and the ability of price to hold above recent support zones near the mid-to-high $70,000s. Derivatives data such as funding rates and open interest provide an additional layer; neutral-to-positive funding alongside declining open interest can indicate that leverage has already been cleaned out, leaving less forced liquidation risk.
Invalidation would appear if the short-term holder SOPR quickly falls back below 1 and remains there while the price makes lower lows. Such a development would suggest that the September reclaim was another temporary bounce rather than a regime change. As of the latest available reporting, the balance of evidence favored the more constructive interpretation, yet the signal remains early and therefore subject to revision if subsequent data diverge. Traders integrating on-chain metrics with traditional price and volume analysis therefore treat the SOPR crossing as one high-value input among several rather than a standalone trading rule.
Contextualizing the Metric Within Overall Market Structure
The short-term holder SOPR reclaim occurs against a broader backdrop of post-halving cycle dynamics, evolving institutional participation, and residual effects from the 2025 peak-and-decline sequence. Realized capitalization and other stock-to-flow-style metrics continue to evolve, while exchange reserves and long-term holder supply have shown patterns consistent with gradual accumulation in some data sets. The SOPR signal fits within this larger picture as an indicator that the most reactive portion of the market has completed a major phase of loss absorption.
No single on-chain reading determines the path of Bitcoin trading levels or the behavior of spot market activity. Its value lies in the concrete evidence it supplies about the profitability of recent participants and the character of current supply. When that evidence shifts from prolonged average losses to modest average gains, the market structure has changed measurably. Continued observation of the same metric, alongside price action and complementary on-chain series, will reveal whether the change proves durable. For now, the data show that short-term holders have crossed an important threshold for the first time in over a year, supplying a factual, evidence-based reference point for assessing the early stages of a potential shift in market regime.
FAQ
1. What does a short-term holder SOPR reading above 1 specifically indicate about recent Bitcoin buyers?
A reading above 1 means that, on average, coins held for less than approximately six months or 155 days are being sold at a price higher than their acquisition cost. This shows that the most recent cohort of market participants has moved from realizing losses to realizing small profits. The shift reduces one source of forced selling and demonstrates that active holders now have a modest positive margin at current prices, a condition that historically appears after prolonged capitulation phases and before more sustained recoveries.
2. Why is the first move above 1 in over a year considered more significant than earlier brief tests?
Earlier tests, such as the May 2026 approach, occurred after shorter intervals of weakness and failed to hold. The September 2026 reading followed a roughly twelve-month stretch of average losses for the same cohort and arrived after a more complete price base had formed near the mid-year lows. The longer preceding loss period and the clearer separation from the temporary May bounce give the latest crossing greater weight as a potential regime marker rather than a transient fluctuation.
3. How does short-term holder SOPR differ from the long-term holder version of the same metric?
Short-term holder SOPR isolates coins younger than the 155-day or six-month threshold and therefore reacts more quickly to near-term price changes. Long-term holder SOPR tracks older coins and tends to move more slowly, remaining elevated during established bull phases and declining mainly during deeper structural corrections. The two series together provide a fuller picture: short-term readings reveal the behavior of reactive participants, while long-term readings show whether patient holders are distributing or holding.
4. What role does the thirty-day moving average play in confirming the signal?
A single daily print above 1 can reverse quickly. The thirty-day moving average smooths short-term noise and indicates whether profit realization has become the prevailing condition rather than an isolated event. Historical bull-market phases featured extended periods in which this average remained above 1. Persistence of the thirty-day series in positive territory would therefore raise confidence that the September reclaim is developing into a more durable shift.
5. Does a modest reading near 1.01 suggest overheating or healthy profit-taking?
A reading only slightly above 1 after a long sub-1 regime is consistent with measured, healthy profit-taking rather than late-cycle distribution. Extreme readings well above 1 or 2 have more often coincided with local or cycle tops. The current modest positive level indicates that short-term holders are locking in small gains without flooding the market, a pattern associated with healthier early-recovery phases.
6. How should the SOPR signal be combined with price action around the $80,000 region?
Price tests of the $80,000–$82,000 zone now occur while short-term holders sit at or above their average cost basis. This alignment means advances face less immediate loss-driven selling from the active cohort. Observing whether price can hold above recent support while the SOPR series remains positive supplies a practical cross-check between on-chain profitability and market structure.
7. What would invalidate the constructive interpretation of the recent SOPR reclaim?
A quick return of short-term holder SOPR below 1 that persists for multiple weeks, especially if accompanied by lower price lows and rising exchange inflows from the short-term cohort, would suggest the September move was temporary. Continued sub-1 readings would indicate that loss realization has resumed and that the prior regime has not been left behind.
8. Are there additional on-chain metrics that currently support or challenge the short-term holder SOPR signal?
Related profitability measures such as overall SOPR, short-term holder realized price relative to spot, and the percentage of supply in profit have generally moved in a compatible direction. None of these metrics alone is decisive, yet their collective improvement reduces the likelihood that the short-term SOPR reclaim is an isolated anomaly and supplies a broader factual context for assessing market conditions.
Disclaimer
This content is for informational purposes only and does not constitute investment advice. Cryptocurrency investments carry risk. Please do your own research (DYOR).