

Bitcoin Price Surge Explained: What a Strong Weekly Close Signals for the Next Market Cycle
2026/08/29 09:34:00
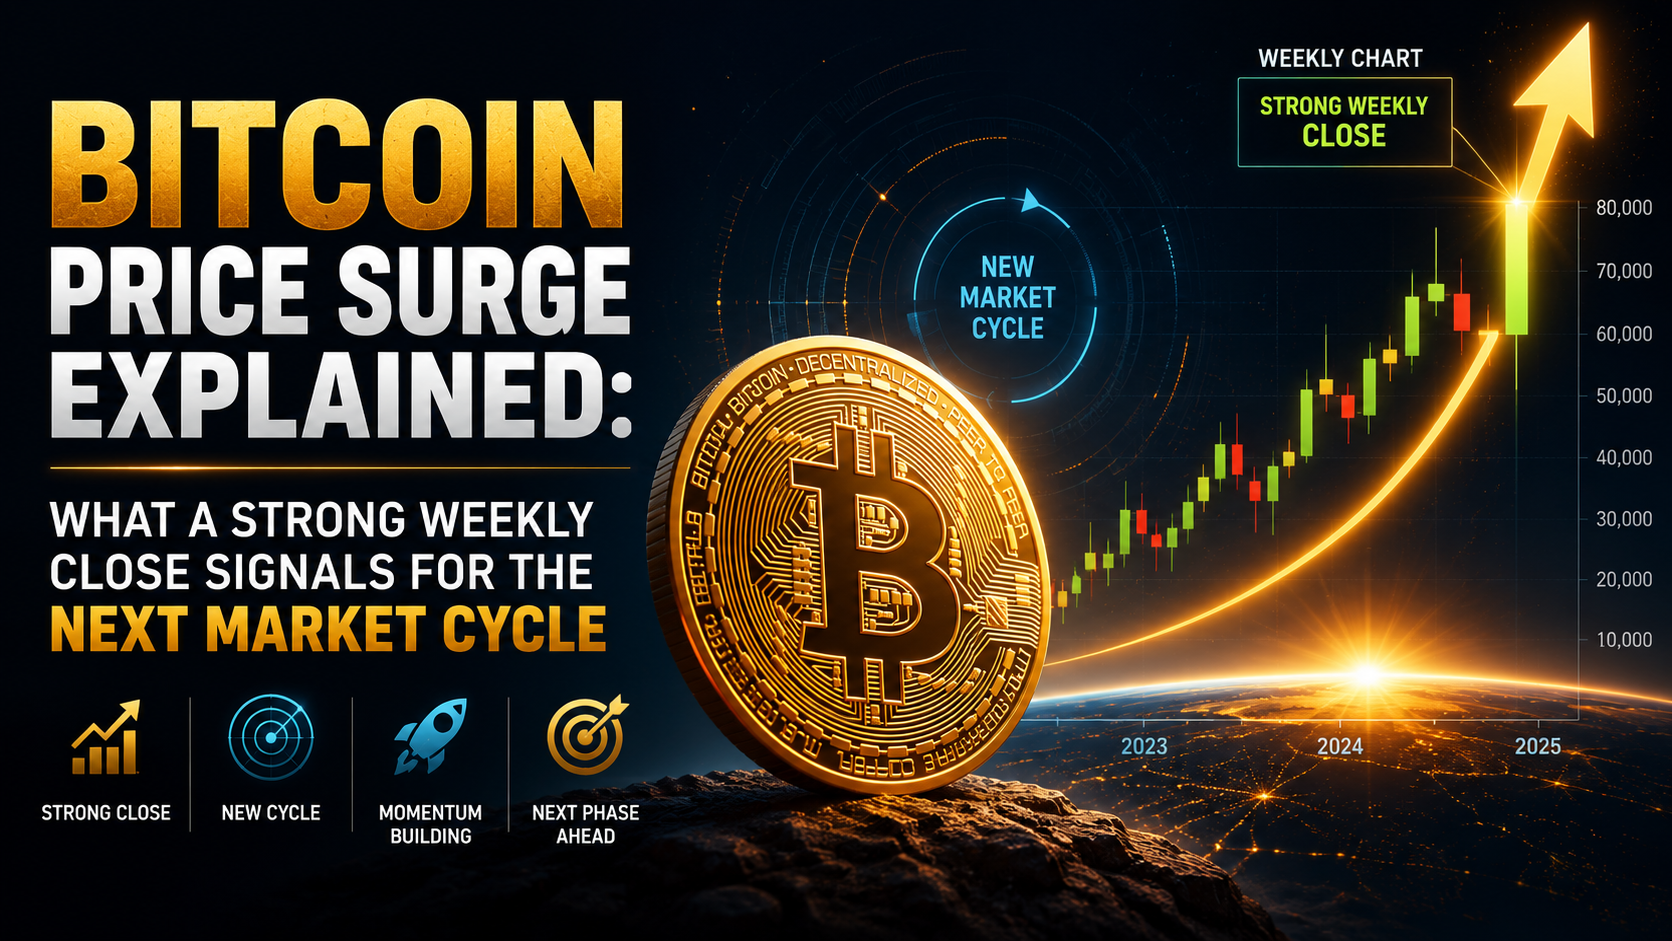
Bitcoin surged by more than 23% during its strongest weekly performance since 2023, climbing from approximately $63,000 to above $77,000 before extending the rally beyond $80,000. The speed of the recovery brought Bitcoin's weekly close, spot ETF demand, derivatives positioning and broader market structure back into focus. The central question is no longer simply why the BTC price increased, but whether buyers can defend the reclaimed range long enough to turn a sharp recovery into the foundation of a more durable bullish phase.
The rally developed through a combination of improving liquidity expectations, renewed demand through U.S. spot Bitcoin ETFs and a large wave of short liquidations. At the same time, Bitcoin recovered several technical and on-chain valuation levels that had acted as resistance during the correction. These developments strengthen the near-term outlook, but they do not guarantee that a new market cycle has already begun. Confirmation will depend on sustained spot demand, controlled leverage, successful support retests and Bitcoin's ability to remain above the $76,000-to-$80,000 region after the initial momentum fades.
Why Did Bitcoin Surge More Than 23% in Its Strongest Week Since 2023
Bitcoin's strongest weekly gain since 2023 resulted from several market forces arriving at the same time. BTC advanced from roughly $63,000 to more than $77,000 during the week and later moved above $80,000 as improving liquidity expectations encouraged investors to rebuild exposure to risk assets. Renewed spot-market demand reduced available supply around important resistance levels, while traders positioned for further weakness were forced to close leveraged shorts. The combination produced a faster move than any single catalyst would probably have generated on its own and helped restore confidence after the earlier correction.
Treasury Buybacks ETF Demand and Short Covering Drove the Bitcoin Rally
One macro catalyst was the U.S. Treasury's announcement that it planned to raise the maximum size of individual long-term debt buyback operations from $2 billion to at least $4 billion. The change was designed to support market liquidity and improve trading conditions in less-liquid Treasury securities. Investors interpreted the announcement as a constructive signal for financial-market functioning at a time when long-term yields remained elevated. However, Treasury buybacks should not be described as quantitative easing: they are debt-management operations that exchange one government liability for another and do not represent a new Federal Reserve money-creation programme. The enlarged operations had also been announced rather than completed when the Bitcoin rally began, making market expectations more important than an immediate injection of cash.
Crypto-specific demand then reinforced the improving macro narrative. Consecutive inflows into U.S. spot Bitcoin ETFs showed that regulated investment demand was returning, while the rapid price advance forced bearish derivatives traders to buy BTC to close losing positions. That interaction created a feedback loop: spot demand helped Bitcoin break resistance, the breakout triggered liquidations and forced purchases then accelerated the move. The rally also attracted momentum traders who had been waiting for evidence that the correction was weakening. Rather than being driven entirely by one headline, Bitcoin's 23% weekly surge reflected a convergence of institutional demand, changing liquidity expectations and a derivatives market that had become vulnerable to a sharp move higher.
What Does Bitcoin's Strong Weekly Close Above $76,000 Mean for Market Structure
Bitcoin's strong weekly close above $76,000 signals a meaningful improvement in BTC market structure because weekly closes carry more weight than brief intraday price spikes. The move shows that buyers were willing to maintain exposure at higher prices instead of immediately taking profits as Bitcoin approached resistance. It also transformed an important valuation area into potential support and strengthened the possibility of a higher-high, higher-low formation on the weekly chart. This pattern is often associated with a market moving away from a prolonged corrective phase and toward renewed price expansion. However, one strong weekly close does not confirm the beginning of a new Bitcoin bull cycle by itself. Continued buying, successful support retests and sustained trading activity will determine whether the breakout develops into a durable trend or becomes another temporary recovery.
Bitcoin Reclaimed Key Technical and On-Chain Price Levels
The Bitcoin price recovery lifted BTC above several closely watched indicators, including the 200-day moving average near $69,000, the short-term holder cost basis around $69,500 and the True Market Mean near $76,000. These levels help investors evaluate Bitcoin's long-term trend, the average entry price of recent buyers and the market's broader on-chain valuation. Reclaiming all three levels together for the first time since November 2025 suggests that buyers absorbed much of the supply held by investors who had previously been underwater. It also returned many short-term Bitcoin holders to an unrealised profit, which could reduce pressure from investors selling simply to exit at their original purchase price. If BTC remains above these benchmarks, market confidence may continue improving as traders interpret the recovery as a structural shift rather than a short-lived relief rally.
From a technical perspective, the breakout could transform the broad $69,000-to-$76,000 region from resistance into a stronger Bitcoin demand zone. Holding this range during future pullbacks would indicate that sellers are losing control while buyers continue defending progressively higher prices. It could also allow the 200-day moving average to become a dynamic support level, further strengthening Bitcoin's medium-term price trend. A successful retest followed by renewed buying would help establish a higher weekly low, one of the clearest signs of improving bullish market structure. Multiple weekly closes above $76,000 would therefore offer more convincing confirmation than a single momentum-driven surge. The longer BTC trades above the reclaimed valuation range, the greater the likelihood that investors will view it as a foundation for the next phase of the Bitcoin market cycle.
The $76,000 Support and $80,000 Breakout Will Determine What Comes Next
The $76,000 level is now the first major support area to monitor in the Bitcoin price outlook. If BTC consolidates above it while market volatility gradually declines, the cryptocurrency could establish a more stable base for its next attempted advance. An orderly trading range between approximately $76,000 and $81,000 would also allow elevated momentum indicators to cool without damaging the broader recovery. Such consolidation would not necessarily be bearish, particularly if trading volume declines during pullbacks and increases when buyers return. This behaviour would suggest that selling pressure remains limited and that investors are using short-term weakness to accumulate Bitcoin. Price reactions, spot-market volume and the strength of each support retest will help determine whether the weekly breakout has lasting market participation behind it.
The next important confirmation zone sits around $80,000 to $81,000, where Bitcoin could encounter increased profit-taking and resistance from investors who bought at higher prices. The $81,000 region is also close to an upper short-term holder valuation band, meaning the market could become temporarily overheated as BTC approaches it. Sustained acceptance above this area, followed by a successful conversion of resistance into support, would strengthen the bullish Bitcoin price trend and improve the probability of movement toward higher historical price ranges. In contrast, a weekly reversal below $76,000 would weaken the breakout and place the $69,000-to-$69,500 region back in focus, with deeper structural support near the $64,000 area. A retest would not automatically end the recovery, but repeated closes below these levels could signal that buyers failed to maintain control. Bitcoin's strong weekly close is therefore constructive for market structure, although it remains an early confirmation signal rather than definitive proof that the next crypto market cycle has begun.
How Spot Bitcoin ETF Inflows and Short Liquidations Strengthened the BTC Rally
Bitcoin's rally was strengthened by two different sources of buying pressure: sustained demand through U.S. spot Bitcoin ETFs and forced purchases from traders closing leveraged short positions. ETF inflows provided a more durable source of spot-market demand, while short liquidations accelerated the move once BTC broke through major resistance levels. Together, these forces created a feedback loop in which rising institutional demand pushed Bitcoin higher, triggering further liquidations and attracting additional momentum traders. Understanding the difference between genuine capital inflows and forced derivatives buying is important when assessing whether the BTC rally can continue.
Nearly $1.92 Billion in Weekly Bitcoin ETF Inflows Supported Spot Demand
U.S. spot Bitcoin ETFs recorded approximately $1.92 billion in net inflows between August 17 and August 21, with positive flows reported across all five trading sessions. This consistent buying was more significant than a single large inflow because it indicated that demand continued even as the Bitcoin price climbed. Spot Bitcoin ETF creations are generally supported by purchases or allocations of underlying BTC, giving the rally a stronger foundation than price gains driven entirely by leveraged futures trading. The inflows also suggested that institutional investors, financial advisers and other regulated-market participants were rebuilding Bitcoin exposure after the earlier correction. Although ETF flows can change quickly and should not be treated as a guaranteed source of demand, several consecutive positive sessions provided evidence that fresh capital was entering the market during the breakout.
Bitcoin Short Liquidations Accelerated the Upward Price Move
As Bitcoin moved rapidly through resistance, bearish traders using leverage were forced to close short positions that had become unprofitable. Market estimates indicated that roughly $2.7 billion to $3 billion in crypto short positions were liquidated during the main rally, with Bitcoin driving much of the broader derivatives-market reaction. Exchanges automatically buy back an asset when a short position no longer has enough collateral, meaning each liquidation adds further upward pressure to an already rising market. This process can develop into a short squeeze, where initial price gains trigger forced purchases, those purchases push prices higher and the next group of short sellers is then liquidated. The resulting chain reaction helped Bitcoin move faster than ordinary spot demand alone might have allowed, particularly as traders who had expected another decline were caught on the wrong side of the breakout.
Derivatives Data Showed Leverage Was Cleared During the Breakout
The rally also produced a noticeable adjustment in Bitcoin derivatives positioning. Perpetual-futures open interest declined by approximately 62,400 BTC as leveraged positions were closed, while CME Bitcoin futures open interest increased by around 11,900 BTC. This divergence suggested that speculative leverage was being removed from parts of the crypto derivatives market even as interest among more institutionally oriented futures participants remained active. Bitcoin funding rates stayed positive but were not at the extreme levels normally associated with an excessively crowded long trade. Clearing a large volume of bearish and overleveraged positions may leave the market in a healthier condition because fewer forced sellers remain if volatility increases. However, a rapid return of highly leveraged long positions could introduce a new liquidation risk if Bitcoin experiences a sharp pullback.
Continued ETF Demand Will Matter After the Short Squeeze Fades
Short liquidations can accelerate a Bitcoin price surge, but they cannot support the rally indefinitely because forced buying ends once the vulnerable positions have been closed. The next stage will depend more heavily on continued spot Bitcoin ETF inflows, broader spot-market volume and investors' willingness to accumulate BTC at higher prices. If ETF demand remains positive while Bitcoin holds its recent gains, the rally would appear less dependent on leverage and more supported by genuine capital allocation. Investors should therefore monitor daily ETF flows, futures open interest, funding rates and spot trading activity for signs of continued demand. A combination of stable ETF inflows and controlled derivatives leverage would support a more sustainable Bitcoin uptrend, while ETF outflows and rapidly rising speculative leverage could make the market more vulnerable to another volatile reversal.
Could Bitcoin's Break Above $80,000 Mark the Beginning of Its Next Market Cycle
Bitcoin's break above $80,000 could represent the early stage of a new bullish phase, but the move alone is not enough to confirm that the next Bitcoin market cycle has begun. Reclaiming this major psychological level after a prolonged correction shows that buyers can absorb selling pressure at substantially higher prices. It also changes the market narrative from defensive recovery to potential trend expansion, particularly if $80,000 turns from resistance into support. However, BTC remains well below its 2025 record high near $126,000, meaning the current rally could still be part of a broader recovery within the existing cycle rather than the beginning of an entirely new four-year cycle. Bitcoin must maintain its gains and attract continued capital inflows before the breakout can be considered a long-term market transition.
Key Signals That Could Confirm Bitcoin's Next Bull Market Cycle
Confirmation of the next Bitcoin bull market cycle would require more than a brief move above $80,000. Traders would want to see several weekly closes above the $80,000-to-$81,000 region, followed by higher weekly lows and successful retests of former resistance. Rising spot-market volume, continued growth in Bitcoin's realised capitalisation and accumulation by long-term holders would provide additional evidence that new money is entering the market. A healthier advance would also be supported by controlled funding rates and gradual growth in futures open interest, rather than a rapid expansion of speculative leverage. If Bitcoin continues rising after the short squeeze has ended, it would suggest that the market is being driven by sustained investor demand instead of temporary forced buying.
Bitcoin's historical four-year pattern also makes the definition of a "new cycle" more complicated. Previous major market peaks occurred around 2013, 2017, 2021 and 2025, while the next Bitcoin halving is expected in 2028. From that perspective, the move above $80,000 may be better described as the beginning of a new recovery or accumulation phase that could eventually develop into the next halving-related expansion. Institutional adoption and spot Bitcoin ETFs may also change the timing and shape of future cycles, making historical comparisons less reliable than they were in earlier years. Supportive global liquidity, lower financial stress and steady demand would strengthen the bullish case, while repeated weekly closes below $76,000 would increase the risk of a failed breakout. The $80,000 move is therefore an encouraging early signal, but the beginning of Bitcoin's next full market cycle will only become clearer through sustained price strength, capital growth and longer-term accumulation.
Conclusion:
Bitcoin's strongest weekly advance since 2023 has materially improved the market's short-term position. The move was supported by a combination of spot demand, changing liquidity expectations and the removal of heavily leveraged bearish positions, while the weekly close restored several indicators that traders use to evaluate trend strength. This gives the recovery a broader foundation than a rally produced solely by derivatives speculation, although the quality of future buying will matter more than the speed of the initial surge.
The break above $80,000 should therefore be treated as a potentially important transition rather than definitive confirmation of Bitcoin's next market cycle. A durable bullish phase would require BTC to defend reclaimed support, maintain healthy spot participation and avoid an excessive rebuild of leverage. If those conditions develop over several weeks, the latest Bitcoin price surge could become the base for a larger expansion. If demand weakens and the breakout range is lost, the rally may instead prove to be a powerful recovery within the existing cycle.
FAQs
When Does Bitcoin's Weekly Trading Candle Close?
Bitcoin trades continuously, but many major crypto exchanges and charting platforms define the weekly candle as ending on Sunday at 23:59 UTC, with the next candle beginning at 00:00 UTC on Monday. The precise cut-off can vary between data providers, so traders should use the same exchange and chart source when comparing weekly closes. A price move shortly before the deadline can materially change the appearance of the weekly candle.
Why Is a Weekly Bitcoin Close More Useful Than an Intraday Price High?
An intraday high only shows the highest price buyers briefly accepted, while a weekly close indicates where the market maintained value after several days of trading. Weekly candles reduce the influence of short-term volatility, temporary liquidity gaps and rapid liquidation events. They can therefore provide a clearer view of the underlying Bitcoin trend, although no individual weekly candle can predict future performance with certainty.
Do Spot Bitcoin ETF Inflows Immediately Affect the BTC Price?
Not always. ETF inflow figures measure net share creations, but the associated Bitcoin exposure may be arranged through exchanges, market makers, custodians or over-the-counter trading desks at different times. Bitcoin also trades globally around the clock, while U.S. ETFs operate during traditional market hours. This means ETF demand can support the market without producing an immediate dollar-for-dollar increase in the BTC price.
Do Bitcoin ETFs Permanently Remove BTC From Circulation?
No. Spot Bitcoin ETFs hold Bitcoin to support their shares, which can reduce the amount of BTC readily available to other market participants while inflows continue. However, those holdings are not permanently removed from circulation because ETF redemptions can cause assets to be sold or transferred. Persistent net inflows may tighten Bitcoin's liquid supply, while sustained outflows can have the opposite effect.
What Is the Difference Between a Short Liquidation and a Stop-Loss?
A short liquidation is an automatic closure initiated by an exchange when a leveraged trader no longer has enough collateral to maintain the position. A stop-loss is a risk-management order voluntarily selected by the trader. Liquidations can produce stronger market effects because multiple forced closures may occur at similar price levels, creating a cascade of automatic buying as Bitcoin moves higher.
Can a Bitcoin Short Squeeze Reverse After Liquidations End?
Yes. A short squeeze can lose momentum once most vulnerable bearish positions have been closed because the forced buying that accelerated the rally is no longer present. If fresh spot demand does not replace it, late buyers may begin taking profits and the Bitcoin price can retrace part of the move. Continued volume after the liquidation wave is therefore more informative than the initial surge alone.
🔥 KuCoin Offers A More Stable Option in A Volatile Market
If you worry about the frequent ups and downs in the market, and pursue a more stable option to earn money passively, KuCoin is the right place to come:

Simple Earn: Deposit and withdraw tokens anytime, earning stable returns.
Kucoin Earn: Earn stable profits with professional asset management.
Hold to Earn: Earn rewards by holding assets in Funding, Trading, Margin, Futures, Mining, and Unified Accounts.
Staking: Unlock the earning potential of on-chain assets.
Advanced Investments: Advanced Investments offer a variety of structured products to help your money grow in any market.
Shark Fin: Principal Protection and Guaranteed Gains
Dual Investment: Buy low and sell high with transparent return calculations.
Snowball: High yields, with price protection.
Discount Buy: Buy crypto at discount prices.
KCS Loyalty: Level up to enjoy exclusive perks by staking ≥ 1 KCS.
KuCoin Wealth: Discover future value and begin your smart investing journey.
KCS Benefits: Hold and stake KCS to access benefits across the platform.
KCS Staking 2.0: Participate in KCS on-chain governance to earn yield.
Disclaimer: This content is for informational purposes only and does not constitute investment advice. Cryptocurrency investments carry risk. Please do your own research (DYOR).