

Fed Rate Hike Looks Locked In for 2026. For Stocks, Is This 2022 or 1997?
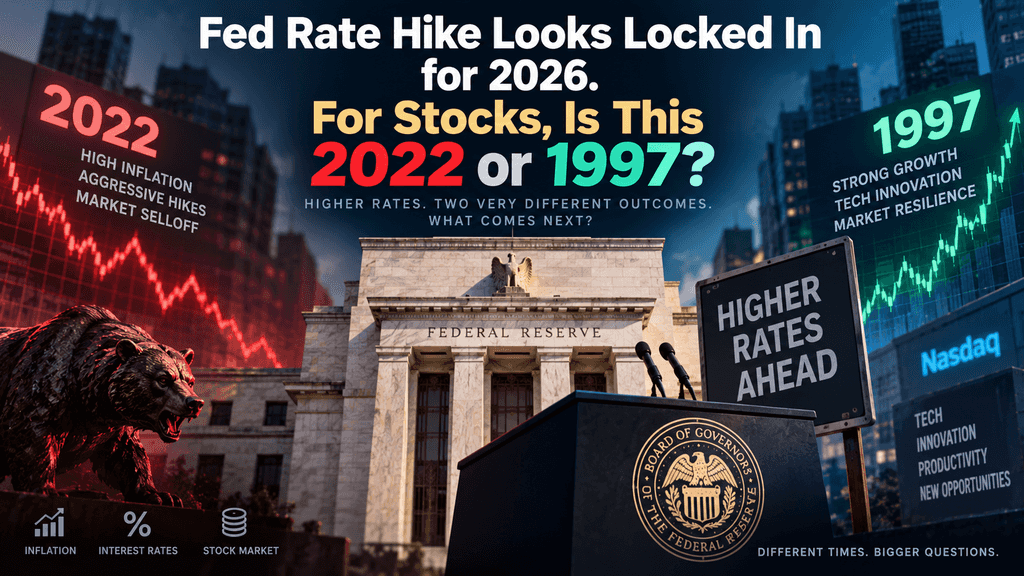
Fed Rate Hike Puts 2026’s Stock Rally to the 1997 or 2022 Test
Investors enter the Federal Reserve’s September 15-16, 2026, policy meeting with near-certainty of a quarter-point rate increase. Futures markets assign roughly 85 to 90 percent odds that the federal funds target range moves from 3.50-3.75 percent to 3.75-4.00 percent, the first hike since 2023. Sticky inflation at 3.4 percent year-over-year, elevated oil prices, and solid labor data have shifted expectations sharply in recent weeks. The S&P 500 trades near 7,580-7,620, up about 11 percent year-to-date and roughly 15 percent over the past twelve months, supported by artificial intelligence capital spending and resilient corporate earnings.
Yet the looming decision raises a central question for equity investors: will the path resemble the aggressive 2022 tightening that produced a 25 percent drawdown, or the mild 1997 adjustment that coincided with a powerful technology-led advance? Current conditions of moderate inflation, ongoing economic growth, and a transformative technology investment cycle point more closely toward the 1997 outcome of short-term volatility followed by continued gains than the severe 2022 bear market, provided the Fed keeps the eventual tightening measured.
Markets Price Nearly Certain September Rate Increase After Sticky Inflation Data
Recent inflation readings have locked in expectations for a Federal Reserve rate hike at the September 16 decision. August core CPI came in hotter than anticipated on a monthly basis, while headline inflation held near 3.4 percent year-over-year. Oil prices have risen sharply, adding pressure through energy costs, and producer price data reinforced the upward bias. CME FedWatch and other futures measures moved from low probabilities just weeks earlier to the current 85-90 percent range for a 25-basis-point increase. This would mark the first upward move since mid-2023 and lift the funds rate into a 3.75-4.00 percent target range. Chair Kevin Warsh’s recent comments emphasizing inflation control further supported the shift.
Bond yields have responded accordingly, with the 10-year Treasury approaching or briefly exceeding 5 percent in early September trading. Equity markets have shown some pressure in the days leading into the meeting, with the S&P 500 retreating modestly from recent highs near 7,800. Yet the broader backdrop remains one of solid growth rather than overheating. Unemployment holds near 4.1 percent, and corporate profit expectations for the third quarter remain elevated. The combination leaves investors focused less on whether a hike occurs and more on the accompanying Summary of Economic Projections and any signals about the future path. Historical patterns indicate that the initial announcement often produces limited immediate reaction once priced in, while the subsequent path of policy and economic data drives performance over subsequent months.
LPL Analysis of Six Tightening Cycles Since 1994 Shows Short-Term Weakness Then Recovery
Jeff Buchbinder, chief equity strategist at LPL Financial, examined six Federal Reserve tightening cycles beginning in 1994. The study found that the S&P 500 typically posted negative average returns across each of the first four months after the initial rate increase. Performance then improved, delivering an average gain of 6.7 percent and a median gain of 10.7 percent over the full twelve months following the first hike. The 1997 episode stands out as an outlier that elevates the averages: after the March 25, 1997, quarter-point move, the index advanced nearly 8 percent in the next two months and 42 percent over the subsequent year. That cycle occurred against the backdrop of expanding internet investment and solid economic growth without a recession.
In contrast, the 2022 cycle produced deeper and more prolonged losses as the Fed raised rates by a cumulative 5.25 percentage points in quick succession. LPL notes that today’s environment features growth that remains positive and a technology capital expenditure cycle centered on artificial intelligence that parallels the late-1990s dynamic more closely than the high-inflation, post-pandemic shock of 2022. The firm also estimates that any additional tightening in the current cycle is unlikely to approach the scale of the previous one. These findings, drawn from LPL research summarized in recent market commentary, underscore that rate hikes alone rarely end bull markets when the underlying economy continues expanding, and earnings support valuations. Investors therefore watch the scale and speed of any further moves more carefully than the first 25-basis-point step.
Charles Schwab Data Spanning Eight Decades Highlights Pace of Tightening as Key Variable
Charles Schwab researchers analyzed S&P 500 performance across 18 post-World War II tightening cycles using Ned Davis Research data. The index has historically gained an average of 18 percent in the twelve months preceding the first rate hike, a figure that closely matches the past year’s advance. After the initial increase, maximum drawdowns averaged 12 percent within six months and 14 percent within twelve months. The pace of subsequent hikes proved decisive. Faster cycles, in which the Fed raised rates at nearly every meeting, produced average drawdowns of 16 percent by the one-year mark. Slower cycles limited the decline to about 12 percent. Non-cycle single adjustments generated even milder pressure.
Current conditions begin from an already elevated funds rate near 3.5-3.75 percent rather than the near-zero starting point of 2022, reducing the cumulative tightening required to reach neutral territory. Markets have also had years to adjust to higher borrowing costs. Schwab’s analysis, published in early September 2026, emphasizes that equity outcomes depend heavily on whether the Fed delivers a measured series of increases or an aggressive campaign. With growth still positive and inflation elevated but not at multi-decade extremes, the data lean toward the milder historical pattern. Investors monitoring the September Summary of Economic Projections will look for clues on the median participant’s expected path through 2027 to gauge which historical template applies.
1997 Single Hike Coincided with Internet Boom and Strong Subsequent Equity Gains
On March 25, 1997, the Federal Reserve raised the federal funds rate by 25 basis points from 5.25 percent to 5.50 percent as a precautionary step against potential inflation pressures. The move proved a one-off adjustment rather than the start of a prolonged campaign. The S&P 500 experienced a brief initial dip of roughly 3 percent over the following weeks as markets digested tighter policy. Momentum then accelerated. The index rose nearly 8 percent in the two months after the hike and delivered a 42 percent gain over the full twelve months. The broader technology and internet investment cycle underway at the time provided a powerful offset to higher borrowing costs.
Corporate capital spending expanded, productivity expectations rose, and earnings growth supported elevated valuations. Economic growth remained intact without tipping into recession. Recent LPL and market analyses draw explicit parallels between that period and the present artificial intelligence infrastructure build-out. Both featured transformative technology investment that sustained equity leadership even as rates moved higher. The 1997 episode demonstrates that a modest, well-telegraphed adjustment need not interrupt a secular growth theme. Equity markets ultimately focused on earnings power and innovation rather than the isolated policy step.
2022 Aggressive Campaign Delivered Rapid 5.25 Percentage Point Tightening and 25 Percent Drawdown
The Federal Reserve began its 2022 tightening cycle on March 16 with a 25-basis-point increase from near zero. Over the next roughly eighteen months, the committee delivered the equivalent of 21 quarter-point moves, lifting the funds rate by a cumulative 5.25 percentage points to a peak range of 5.25-5.50 percent. Inflation had reached multi-decade highs near 9 percent, prompting the aggressive response. The S&P 500 fell into a bear market, recording a peak-to-trough decline of approximately 25 percent. Losses persisted for more than a year after the initial hike, with the index remaining lower through much of 2022 before bottoming in October.
Growth stocks with long-duration cash flow profiles suffered particularly sharp valuation compression as discount rates rose. By mid-2023, the cumulative tightening had slowed demand sufficiently for inflation to decline, and equities recovered. Investors who held through the cycle, eventually recorded gains of roughly 61 percent from the first hike by later dates. The scale and speed of the 2022 campaign distinguish it from milder historical episodes. Starting from zero rates and confronting supply-driven inflation created conditions that required far more cumulative tightening than current projections imply. Market commentary repeatedly contrasts the limited room and different inflation profile of 2026 with that earlier experience.
Artificial Intelligence Capital Spending Provides Parallel Support to Late-1990s Technology Cycle
Corporate investment in artificial intelligence infrastructure has emerged as a primary driver of equity market leadership in 2026. Capital expenditure by major technology firms on data centers, chips, and related hardware continues at elevated levels, supporting earnings growth and offsetting some pressure from higher rates. This dynamic mirrors the late-1990s internet build-out that helped equities advance through the 1997 rate adjustment. Analysts at LPL and others note that the current technology investment cycle can sustain demand for related equities even as borrowing costs rise modestly. Profit expectations for the third quarter of 2026 remain robust, with some estimates pointing to strong year-over-year earnings gains.
The concentration of returns among the largest technology companies has produced index-level strength while median company performance lags, a pattern also observed during prior innovation waves. Higher rates raise the cost of financing large projects, yet the expected productivity and revenue gains from AI deployment have so far outweighed that headwind in market pricing. Equity strategists emphasize that the durability of this spending cycle will influence whether post-hike performance tracks the stronger historical outcomes. Ongoing monitoring of capital expenditure guidance and semiconductor demand provides a practical gauge of the theme’s resilience. Recent sector performance data show technology and related areas continuing to contribute meaningfully to overall index returns despite the shift in rate expectations.
Valuation Metrics Sit at Elevated Levels That Amplify Sensitivity to Rate Path
The S&P 500 Shiller CAPE ratio has reached readings near 40.5 in recent months, among the highest levels recorded since the late nineteenth century. Such elevated valuations have historically preceded periods of lower forward returns and increased vulnerability to policy shifts. The metric has remained above 30 for consecutive months on only a limited number of prior occasions, several of which were followed by meaningful corrections. Current price-to-earnings multiples also reflect the premium placed on growth and technology leadership. Higher interest rates increase the discount rate applied to future cash flows, which can compress multiples more noticeably when starting valuations are already high.
In 2022, this mechanism contributed to the sharp drawdown in long-duration equities. The present environment starts from higher rates already in place, so the marginal impact of an additional 25 or 50 basis points may prove less severe. Earnings growth remains the critical offset. If corporate profits continue expanding at the rates currently projected, the market can absorb modest multiple compression. Conversely, any disappointment in the growth outlook would leave valuations more exposed. Investors tracking the CAPE and forward earnings estimates gain insight into the margin of safety available as the Fed begins to tighten. Historical comparisons show that elevated valuations do not preclude positive returns when earnings deliver, but they do raise the importance of the policy path remaining measured.
Economic Growth and Labor Market Strength Differentiate Current Backdrop from 2022
Real GDP growth projections for 2026 remain positive in the range of roughly 2 percent according to recent Federal Reserve and private forecasts. Unemployment has held near 4.1 percent, with job growth continuing at a moderate pace. These conditions stand in contrast to the more disrupted post-pandemic environment of 2022, when supply shocks and rapid demand recovery produced extreme inflation. Current inflation, while above the 2 percent target, reflects a mix of energy prices, residual policy effects, and solid demand rather than the broad-based surge seen earlier. The absence of an imminent recession risk in most forecasts supports the view that a limited tightening cycle can coexist with ongoing expansion.
Charles Schwab and LPL analyses both highlight that rate-hiking cycles occurring against a backdrop of growth have historically produced better equity outcomes than those forced by runaway inflation. Corporate balance sheets and consumer spending data continue to show resilience. The combination reduces the probability that a September hike, or even one or two additional moves, will tip the economy into contraction. Market participants therefore focus on the evolution of inflation components and employment reports for confirmation that growth remains the dominant force. Positive economic data reinforce the case that equity markets can adapt to moderately higher rates without the severe valuation reset observed in 2022.
Bond Yields Have Already Adjusted Higher Ahead of the Policy Decision
The 10-year Treasury yield has climbed toward and briefly above 5 percent in the days preceding the September meeting, reflecting both inflation concerns and the rising probability of tighter policy. Longer-dated yields have also moved higher, with the 30-year approaching multi-year peaks in some sessions. This preemptive adjustment means that much of the expected rate increase is already priced into fixed-income markets and, by extension, into equity discount rates. In prior cycles, sharp post-hike yield spikes often accompanied the largest equity drawdowns. The current configuration suggests that the immediate impact on valuations may prove more contained.
Equity strategists note that the move in yields has been orderly rather than disorderly, limiting spillover into broader financial conditions. Credit spreads remain relatively tight, indicating limited stress in corporate funding markets. The combination of higher but stable yields and resilient growth forms a different backdrop from the rapid yield surge that accompanied the early stages of the 2022 campaign. Investors monitoring the 2-year yield as a gauge of near-term policy expectations find it already embedding the expected September move and additional probability of further increases. This market-based pricing reduces the element of surprise that can amplify short-term volatility after the formal announcement.
Historical Averages Mask Significant Variation Across Individual Tightening Episodes
Across multiple studies of post-war and post-1994 cycles, average twelve-month returns after the first rate hike cluster in the mid-single digits to low double digits. Those averages conceal wide dispersion. The 1997 episode delivered 42 percent, while 2022 produced negative returns for an extended period. Cycles that remained slow and limited in scale tended to coincide with continued bull markets. Faster and larger cumulative increases more often generated deeper drawdowns. The distinction matters because current market pricing and private forecasts point to a modest number of additional hikes rather than a multi-percentage-point campaign.
CNBC survey respondents in mid-September 2026 shifted toward expecting at least two increases over the coming year, a notable change from prior months, yet still far below the 2022 total. The median participant projection in the June Summary of Economic Projections already incorporated some upward adjustment for year-end 2026. Updated September projections will provide the next formal view. Equity performance will ultimately depend less on the average of past cycles and more on whether the realized path aligns with the slower historical subset. Analysts therefore emphasize scenario analysis over reliance on simple averages when positioning portfolios around the current decision.
Corporate Earnings Growth Remains the Primary Offset to Higher Discount Rates
Third-quarter earnings expectations for the S&P 500 point to strong year-over-year growth, with some estimates exceeding 20 percent in certain analyses. Technology and related sectors continue to lead the contribution. Higher interest rates raise the cost of capital and can pressure interest-sensitive sectors, yet the overall earnings trajectory provides a fundamental cushion. Companies have adapted to the higher-rate environment that has prevailed since 2022, adjusting capital structures and pricing power where possible. The AI-related investment wave further supports revenue and margin expectations for key index constituents. Historical episodes in which earnings expanded through a tightening cycle produced the more favorable equity outcomes.
Conversely, periods of simultaneous rate increases and earnings disappointment generated the weaker results. Current guidance and analyst estimates still lean toward continued expansion, though the concentration of growth among a smaller group of large firms introduces concentration risk. Portfolio managers monitoring earnings revisions and capital expenditure plans gain early signals of whether the fundamental backdrop can absorb the policy shift. The interplay between earnings delivery and the pace of rate increases will shape the path of valuations and total returns over the coming year.
Investor Positioning and Market Technicals Reflect Elevated Caution Ahead of Decision
Equity markets have shown increased volatility in the sessions leading into the Federal Open Market Committee meeting, with the S&P 500 posting several down days and the VIX moving higher from recent lows. Trading volumes and options positioning indicate hedging activity around the event. Yet the longer-term trend remains constructive, with the index still well above levels from a year earlier. Technical support levels near recent lows will be tested if the post-decision reaction proves negative. Historical patterns show that the first few months after an initial hike often feature choppy performance even when the twelve-month outcome is positive.
Investors with longer horizons have historically been rewarded for remaining invested through those periods when the economic expansion continued. Short-term traders face greater uncertainty around the immediate reaction to the statement, projections, and press conference. The combination of elevated valuations and a policy inflection increases the potential for sharp moves in either direction on the announcement day itself. Positioning data and sentiment surveys will provide additional context for how markets absorb the outcome. Overall, the technical picture supports the view that any weakness is more likely to represent an interruption within an ongoing advance than the start of a prolonged decline, provided growth indicators hold.
Measured Tightening Path Would Align More Closely with Favorable Historical Precedents
Private forecasts and futures pricing currently embed a limited number of additional rate increases beyond September. CNBC survey participants shifted toward expecting two or more hikes over the next year, while some bank forecasts project a peak near 4.125 percent. This scale remains far smaller than the 2022 cumulative move. A path of one or two further 25-basis-point steps would more closely resemble the slower tightening cycles that historically produced milder drawdowns and positive twelve-month equity returns. The June Summary of Economic Projections already showed an upward revision in the median funds rate path, and the September update will refine that view under the new chair.
Market participants will scrutinize the distribution of dots for signs of a more aggressive or more patient committee. Economic data over the remainder of 2026, particularly inflation and employment prints, will determine whether the limited path materializes. Equity strategists note that the combination of growth resilience, AI investment, and a moderate policy response creates conditions closer to 1997 than to 2022. The outcome for stocks will hinge on the interaction of these factors rather than the isolated September decision. Continuous assessment of incoming data and Fed communications remains the practical approach for navigating the period ahead.
🔥 Beyond the Headlines: What KuCoin 5.0 Means for You
Market news moves fast — but where you act on it matters just as much. This October, KuCoin launches KuCoin 5.0, transforming KuCoin into a rebuilt platform. Here's what actually changes for you:
-
One account for everything. Older platforms split your money across separate "spot," "margin," and "futures" accounts and expected you to understand why. KuCoin 5.0's unified account removes that entirely — deposit once, and everything is simply there.
-
Stocks, indices, and commodities. KuCoin 5.0 expands beyond crypto into global markets. When crypto chops sideways and equities rally (or the reverse), you rotate in minutes instead of opening a brokerage account and waiting days for fiat rails.
-
Real-world assets (RWA). Tokenized exposure to traditional assets like commodities, right inside your crypto account. One of the fastest-growing segments in global finance is no longer reserved for institutions — you access it from the same balance you trade with.
-
Earn while you learn. Not ready to trade? KCUSD lets your stablecoins earn daily, auto-compounding interest. The lowest-stress way to put your idle deposit to work for 4% yield.
-
An AI assistant in plain language. Ask questions, get market context, understand what you're looking at — built into the platform, no jargon required.
-
An app that doesn't overwhelm. Faster, cleaner, and consistent — intuitive from the first tap, not after a tutorial.
-
Safety you can check, not just trust. A MiCAR-licensed EU entity, Proof of Reserves you can verify yourself, and internationally certified security (SOC 2 Type II, ISO 27001:2022).
Create your account in minutes — and start on the platform built for where crypto is going, not where it's been.
FAQs
How probable is a Federal Reserve rate hike at the September 16, 2026, meeting?
Futures markets and economist surveys place the probability in the 85 to 90 percent range for a 25-basis-point increase that would raise the target range to 3.75-4.00 percent. The shift occurred after hotter-than-expected core inflation data and rising oil prices. The decision itself is widely anticipated, so the accompanying economic projections and any commentary on the future path will likely matter more for markets than the rate move alone.
What does historical data show about S&P 500 performance after the first rate hike in a cycle?
Studies of cycles since 1994 and longer post-war samples show average negative returns in the first few months followed by positive twelve-month results in the mid-single to low double digits. The 1997 cycle produced a 42 percent gain over twelve months, while 2022 generated a 25 percent drawdown. Outcomes vary significantly with the pace and scale of subsequent tightening and the strength of the economy.
Does the current environment more closely resemble 1997 or 2022?
Multiple equity strategists argue that positive growth, a technology investment cycle centered on artificial intelligence, and the limited scale of expected tightening align more closely with the 1997 experience. The 2022 campaign featured far larger cumulative rate increases starting from near-zero levels against multi-decade-high inflation. Current inflation is elevated, but the starting rate level is already higher, and growth remains intact.
How important is the pace of any further rate increases?
Charles Schwab analysis shows that faster cycles historically produced deeper average drawdowns of about 16 percent within twelve months, compared with 12 percent for slower cycles. Market pricing and private forecasts currently embed a modest number of additional moves rather than an aggressive campaign, which would favor the milder historical outcomes if realized.
What role does artificial intelligence spending play in the equity outlook?
Corporate capital expenditure on AI infrastructure continues at high levels and supports earnings growth among key index constituents. Strategists compare this dynamic to the late-1990s internet investment wave that helped equities advance through the 1997 rate adjustment. The durability of this spending remains a key variable for whether markets can absorb higher rates without significant multiple compression.
Disclaimer: This content is for informational purposes only and does not constitute investment advice. Investments carry risk. Please do your own research (DYOR).