


RSI Indicator for Crypto Trading: How to Read Bitcoin and Altcoin Momentum Like a Pro
Introduction
Imagine watching the price of a crypto asset climb sharply for several days in a row. It looks strong, almost unstoppable. But is that momentum sustainable, or is the market already pushing too far?
This is the problem the Relative Strength Index (RSI) was designed to solve. It measures the speed and magnitude of recent price movements and turns them into a clear, visual signal of momentum.
RSI does not predict what comes next. Instead, it helps you assess whether a move is strengthening or losing pace. This makes it useful for both active traders and anyone trying to better understand how markets behave.
In this guide, you will learn what RSI is, how it is calculated in a simple way, how to interpret its signals in real market conditions, and where it can mislead you if used without proper context. By the end, you'll have a clear framework for using RSI as a practical tool in your crypto trading strategy.
What Is the RSI Indicator? and How It Works in Crypto
Origin of the RSI Indicator
The Relative Strength Index (RSI) was introduced in 1978 by J. Welles Wilder Jr. in New Concepts in Technical Trading Systems. It was designed to filter out short-term price noise and highlight the underlying strength or weakness of market momentum.
Although RSI was originally built for commodities, it has become widely used in crypto trading. Cryptocurrency markets are highly driven by sentiment and momentum, with prices often moving rapidly in response to shifts in demand. RSI is well suited to this environment because it captures those momentum extremes in a simple, measurable way.
What the RSI Indicator Measures
At its core, RSI measures the speed and magnitude of recent price movements. It compares the average gains to average losses over a set period, typically 14 candles.
RSI does not determine whether an asset is fundamentally valuable. Instead, it shows whether buying or selling pressure has become unusually strong.
-
High RSI values suggest strong buying pressure
-
Low RSI values indicate strong selling pressure
-
Mid-range values suggest a balanced or consolidating market
This makes RSI a useful tool for identifying when momentum may be overstretched.
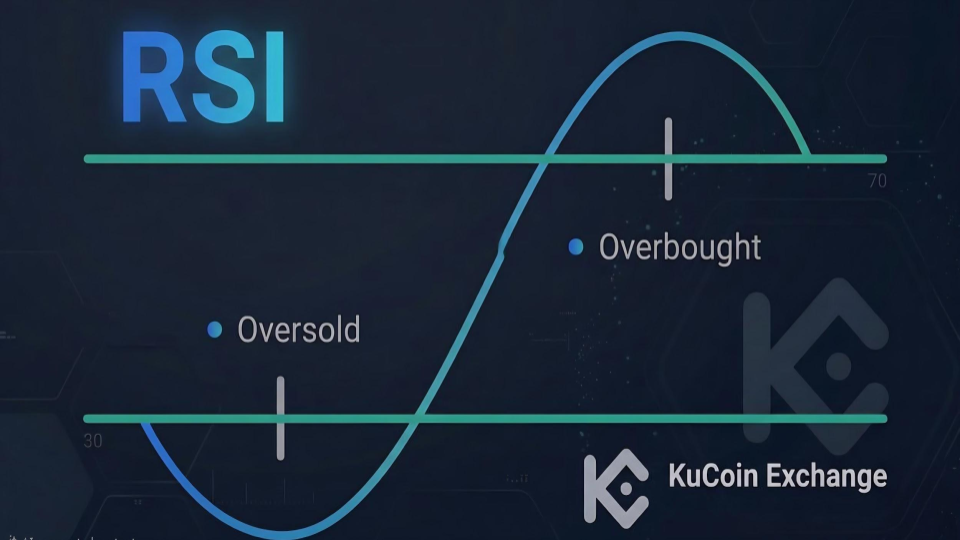
Understanding RSI Values
RSI is displayed as a number between 0 and 100.
-
Above 70 often signals overbought conditions
-
Below 30 often signals oversold conditions
-
Around 50 suggests neutral momentum
These levels do not guarantee reversals, but they highlight areas where price movement may slow or change direction.
RSI is calculated using the formula:
RSI = 100 - 1001+RS
Where RS represents the average gain divided by the average loss over the selected period.
Most trading platforms calculate this automatically, so manual calculation is not required. What matters is understanding the output.
-
Rising RSI reflects sustained upward momentum
-
Falling RSI reflects sustained downward momentum
-
Stable RSI suggests consolidation
Why RSI Is Effective in Crypto Markets
Crypto markets move quickly and often with sharp swings in price. These conditions create frequent periods where buying or selling pressure becomes extreme.
The RSI indicator is effective in this environment because it focuses on momentum rather than price alone. It shows how strong recent moves are and whether that strength is increasing or fading.
In fast-moving markets, prices can rise or fall rapidly without clear context. RSI helps fill that gap by indicating when momentum is becoming stretched. This allows traders to better assess whether a move is likely to continue or begin to slow down.
RSI does not eliminate uncertainty, but it provides a structured way to interpret market behavior, which is essential in highly volatile conditions like crypto.
How to Read RSI in Crypto: Zones, Signals, and Trading Context
RSI Levels Explained: Key Zones in Crypto Trading
RSI moves between 0 and 100, but the most important levels are 30 and 70. These thresholds divide the indicator into zones that reflect market momentum.
|
RSI Zone |
Value Range |
What It Suggests |
|
Overbought |
Above 70 |
Strong buying pressure, potential slowdown |
|
Neutral |
30 - 70 |
Balanced momentum |
|
Oversold |
Below 30 |
Strong selling pressure, potential rebound |
|
Extreme Overbought |
Above 80 |
Highly stretched conditions |
|
Extreme Oversold |
Below 20 |
Panic-driven selling |
In crypto markets, these levels behave differently. Strong trends can push RSI above 70 or below 30 for extended periods. A rising market can remain overbought while price continues to climb, which means RSI signals must be interpreted within context, not in isolation.
Overbought RSI in Crypto Markets
When RSI moves above 70, it signals strong buying pressure. In traditional markets, this often leads to a pullback. In crypto, it often confirms that a strong trend is underway.
During major bull cycles, RSI can stay above 70 for extended periods. Selling solely because RSI enters this zone can lead to missed opportunities.
A more reliable signal appears when RSI exits the zone. When RSI rises above 70 and then drops back below it, this shift often signals weakening momentum. The signal becomes stronger when combined with declining volume or bearish price patterns.
Oversold RSI in Crypto Markets
When RSI falls below 30, it indicates strong selling pressure. In crypto, this often aligns with periods of fear or market-wide downturns.
Oversold conditions have historically appeared near major market bottoms. However, RSI can remain below 30 during prolonged downtrends, so early entries carry risk.
A clearer signal appears when RSI moves back above 30. This suggests that selling pressure is easing and momentum may be shifting.
RSI Divergence in Crypto Trading
Divergence occurs when price and RSI move in opposite directions. It is one of the more reliable ways to detect weakening momentum.
Bullish Divergence
Price forms a lower low, but RSI forms a higher low. This indicates that selling pressure is weakening even as price declines. It can signal early accumulation.
Bearish Divergence
Price forms a higher high, but RSI forms a lower high. This indicates weakening buying pressure. The trend may be losing strength.
Divergence does not confirm reversals on its own, but it provides an early warning that momentum is shifting.
Best RSI Timeframes for Crypto Trading
Because crypto markets trade continuously, lower timeframes produce frequent but less reliable signals.
-
Short timeframes (e.g. 15-minute): high noise, frequent signals
-
Medium timeframes (4-hour, daily): more reliable for most traders
-
Higher timeframes (weekly): useful for identifying broader trends
Many traders use a layered approach:
-
Weekly RSI for overall market direction
-
Daily RSI for primary signals
-
4-hour RSI for entry timing
This approach reduces false signals and improves consistency.
Best RSI Strategies for Crypto Trading
RSI Oversold Bounce Strategy
This strategy focuses on buying after extreme selling pressure.
When RSI drops below 30, the market is often stretched to the downside. In crypto, this can happen during sharp, sentiment-driven selloffs.
How it works:
-
Wait for RSI to fall below 30
-
Look for RSI to move back above 30
-
Confirm with a bullish price pattern (e.g. strong rejection or reversal candle)
-
Enter after confirmation
-
Place a stop-loss below the recent low
Why it works:
It captures mean reversion after panic-driven selling, which is common in crypto markets.
RSI Trend-Following Strategy in Bull Markets
In strong uptrends, RSI is more effective as a trend tool than a reversal signal.
Instead of selling overbought conditions, this strategy focuses on buying pullbacks.
How it works:
-
Confirm an uptrend (price holding above a key moving average)
-
Watch for RSI to pull back to the 40–50 range
-
Enter when RSI stabilizes or turns upward
-
Avoid shorting simply because RSI is above 70
Why it works:
Strong trends can keep RSI elevated. Pullbacks offer better entry points than trying to time reversals.
RSI Divergence Strategy for Altcoins
Divergence helps identify weakening momentum before price reverses.
Altcoins often show clearer divergence patterns due to their volatility and cycle behavior.
Bullish Divergence Setup
-
Price forms a lower low
-
RSI forms a higher low
-
Wait for a breakout above a recent resistance level
-
Enter after confirmation
Bearish Divergence Setup
-
Price forms a higher high
-
RSI forms a lower high
-
Watch for breakdown below support
-
Enter after confirmation
Why it works:
It highlights hidden shifts in momentum before they appear in price.
Adjusting RSI Settings for Crypto Markets
Default RSI settings may not always fit crypto’s volatility.
Shorter periods react faster, while longer periods filter noise.
Common RSI Settings
-
RSI(7) or RSI(9): faster signals, more noise
-
RSI(14): balanced default
-
RSI(21): smoother, fewer signals
Choosing the Right Setting
-
Lower timeframes: shorter RSI periods
-
Higher timeframes: standard or longer periods
-
Stay consistent with your chosen setup
Why it matters:
Consistency improves decision-making and reduces false signals.
Why RSI Is One of the Best Indicators for Crypto Trading
RSI remains widely used in crypto trading because it addresses key challenges in fast-moving markets. It helps quantify market emotion, works across all assets, adapts to 24/7 trading conditions, and provides a consistent framework for decision-making.
RSI Measures Market Emotion Through Momentum
Crypto markets are heavily driven by sentiment. Rapid shifts between fear and greed often lead to sharp price movements.
RSI translates these emotional swings into measurable momentum. When selling pressure intensifies, RSI falls. When buying pressure accelerates, RSI rises.
This allows traders to assess market behavior objectively rather than reacting to headlines or crowd sentiment.
RSI Works Across All Crypto Assets
RSI only requires price data, which makes it applicable to any cryptocurrency with sufficient trading history.
It can be used on major assets like Bitcoin and Ethereum, as well as smaller altcoins. The calculation remains consistent across exchanges and trading pairs.
This consistency allows traders to apply the same framework across different markets without adjusting the core logic.
RSI Adapts to 24/7 Crypto Markets
Crypto markets operate continuously, without opening or closing sessions.
RSI updates in real time as new price data forms. This ensures that momentum readings reflect current market conditions at all times.
Unlike traditional markets, there are no gaps that distort indicator readings, which makes RSI more consistent in crypto environments.
RSI Provides a Structured Framework for Traders
RSI is widely available on all major charting platforms and does not require advanced tools or data sources.
It gives traders a simple framework for analyzing momentum, identifying extremes, and timing decisions.
Why This Matters for Retail Traders
-
No need for complex models or proprietary data
-
Consistent signals across different assets
-
Clear rules for interpreting market conditions
This accessibility makes RSI a practical tool for both beginners and experienced traders.
Common RSI Mistakes in Crypto Trading (And How to Avoid Them)
RSI is a powerful tool, but it is often misused. Understanding its limitations and common mistakes is essential for using it effectively in crypto markets.
Mistake 1: Treating Overbought RSI as a Sell Signal in Bull Markets
In strong uptrends, RSI can remain above 70 for extended periods. This reflects sustained buying pressure, not an immediate reversal.
Selling solely because RSI is overbought often leads to missed gains or premature short positions.
What to Do Instead
-
Use trend context before acting on RSI
-
Treat overbought conditions as strength in bull markets
-
Look for confirmation such as divergence or weakening volume before exiting
Mistake 2: Using RSI on Low-Liquidity Altcoins
RSI depends on reliable price data. On low-liquidity assets, price movements can be easily distorted.
This leads to misleading RSI signals that do not reflect true market momentum.
What to Do Instead
-
Focus on high-liquidity assets
-
Be cautious with small-cap altcoins
-
Combine RSI with volume or market structure analysis
Mistake 3: Overtrading RSI Signals in a 24/7 Market
Crypto markets generate continuous RSI signals across all timeframes.
Reacting to every signal leads to overtrading, higher costs, and inconsistent decisions.
What to Do Instead
-
Define clear rules for when to act on RSI
-
Focus on specific timeframes
-
Ignore low-quality or frequent signals
Mistake 4: Relying on RSI Alone
RSI measures momentum, but it does not account for broader market conditions.
External factors such as news, macro trends, and liquidity shifts can override RSI signals.
What to Do Instead
-
Combine RSI with trend indicators (e.g. moving averages)
-
Use volume to confirm signals
-
Consider overall market conditions before acting
Conclusion
RSI is a practical tool for reading momentum in crypto markets, but its value depends on how it is applied. It helps identify when buying or selling pressure is strengthening or fading, giving structure to otherwise volatile price movements.
However, RSI is not a standalone signal. Overbought and oversold readings can persist in strong trends, and signals such as divergence or zone crossbacks require context to be meaningful. When used in isolation or without regard to trend, liquidity, and market conditions, RSI can lead to poor decisions.
The most effective approach is to treat RSI as one component of a broader strategy. Combine it with trend analysis, volume, and clear rules for entry and exit. Focus on consistency rather than reacting to every signal.
Used this way, RSI becomes a reliable way to interpret momentum and support more disciplined trading decisions in crypto markets.
FAQs
What is the RSI indicator in cryptocurrency trading?
The RSI (Relative Strength Index) is a momentum indicator used in crypto trading to measure the speed and strength of price movements. It ranges from 0 to 100 and helps identify whether a market is overbought, oversold, or neutral.
How does the Relative Strength Index (RSI) work in crypto markets?
The Relative Strength Index compares average gains and losses over a set period, usually 14 candles. In crypto markets, it helps traders assess momentum by showing whether buying or selling pressure is increasing or weakening.
What are the best RSI levels for crypto trading?
Common RSI levels are 70 and 30. Above 70 suggests overbought conditions, while below 30 suggests oversold conditions. These levels help traders identify potential momentum extremes, but they should always be interpreted within market context.
Is RSI reliable for crypto trading?
RSI is useful for analyzing momentum, but it is not fully reliable on its own. Crypto markets can remain overbought or oversold for extended periods, so RSI should be combined with trend analysis, volume, and other indicators for better accuracy.
How is RSI used in cryptocurrency trading strategies?
Traders use RSI crypto trading strategies such as oversold bounce setups, trend-following entries, and divergence signals. These approaches help identify potential entry and exit points based on momentum shifts rather than price alone.
What are common mistakes when using the RSI indicator in cryptocurrency?
Common mistakes include treating overbought RSI as an automatic sell signal, using RSI on low-liquidity altcoins, overtrading every signal, and relying on RSI alone without considering trend or broader market conditions.