

Bitcoin Market Bottom Signals: What Short-Term Holder Supply Says About BTC's Next Move
Introduction
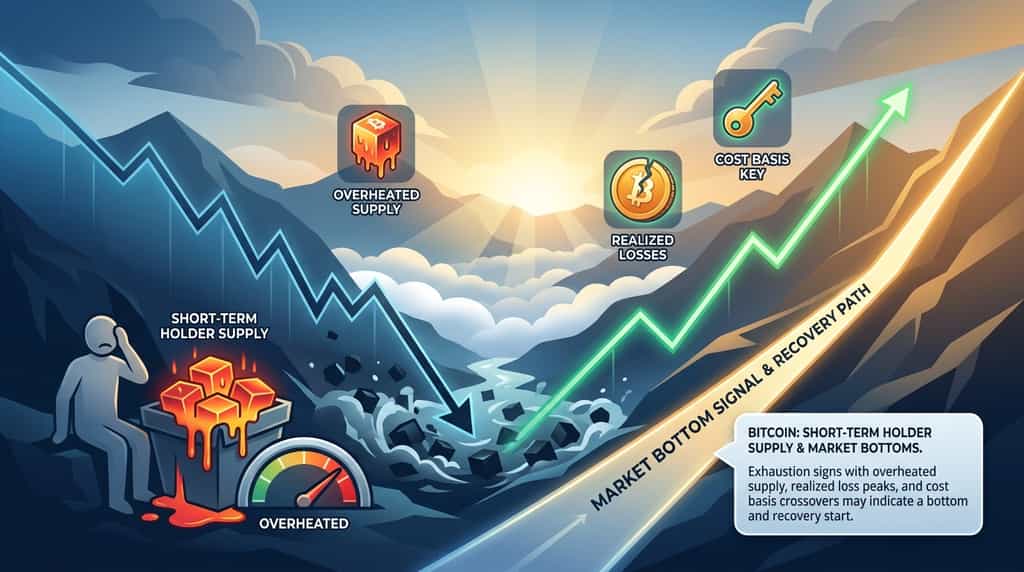
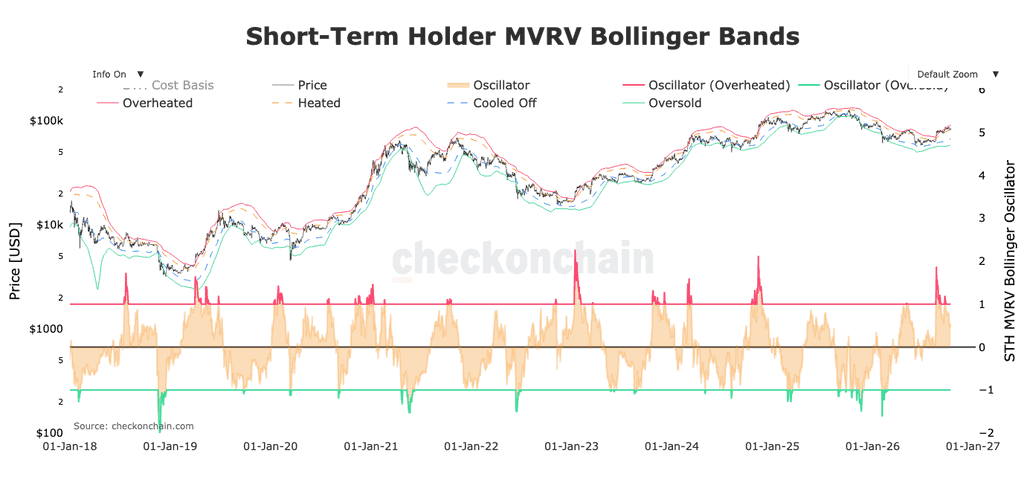
Can Bitcoin's short-term holder supply help identify a market bottom before prices begin a sustained recovery? On-chain analyst Killa argues that the recent rise in Bitcoin (BTC) short-term holder (STH) supply has reached an overheated level similar to the conditions observed in 2023, when Bitcoin began recovering from its macroeconomic market bottom. The comparison suggests that the current market structure may offer clues about BTC's next move, although it does not guarantee that prices have bottomed.
Short-term holder supply measures the Bitcoin held by investors who acquired their coins relatively recently. Changes in this cohort can reveal shifts in investor participation, speculative demand, and the distribution of coins between newer and more established holders. When interpreted alongside profitability metrics, realized losses, and price action, STH supply can help investors assess whether a sell-off is approaching exhaustion or whether further downside remains possible.
The key is to distinguish a potential bottoming signal from confirmation of a trend reversal.
What Is Bitcoin Short-Term Holder Supply?
Bitcoin short-term holder supply measures the amount of BTC held by investors whose coins fall within a relatively recent acquisition-age window. Glassnode's methodology generally distinguishes short-term and long-term holders using a 155-day threshold, with a gradual transition around that age rather than an abrupt classification change.
This metric helps analysts understand how much Bitcoin is held by newer market participants and how their holdings evolve as market conditions change. Unlike trading volume, which measures activity over a period, STH supply describes the stock of Bitcoin attributed to a particular holder cohort at a given time.
Why Could Elevated Short-Term Holder Supply Signal a Bitcoin Market Bottom?
Elevated short-term holder supply can become a useful market-bottom signal when it coincides with a change in selling pressure, improving price structure, or evidence that recent buyers are absorbing available supply. However, a high STH supply reading alone is not inherently bullish or bearish.
In the analysis on X, trader Killa points to similarities between current short-term holder supply conditions and those observed in 2023 after Bitcoin emerged from its macroeconomic bottom. The argument is that a market can remain structurally constructive even when sentiment indicators appear pessimistic or speculative positioning looks overheated.
The distinction is important: the signal is not that more short-term holders automatically cause Bitcoin to rise. Rather, the distribution of supply among newer investors can help explain how the market may respond to further price movements.
Which Bitcoin Market Bottom Signals Should Traders Watch Alongside STH Supply?
Traders should combine STH supply with cost-basis levels, realized losses, spot demand, and market structure to assess whether Bitcoin is approaching a durable bottom. These indicators measure different aspects of the market, so agreement between them is more informative than any isolated signal.
1. Short-Term Holder Cost Basis
The short-term holder cost basis estimates the average acquisition price of coins held by recent market participants. It can act as a dynamic reference level because traders often respond to whether their holdings are profitable or underwater.
When BTC trades below the STH cost basis, recent buyers collectively face greater unrealized losses. This can create overhead resistance if holders sell as the price approaches their breakeven level. However, the cost basis is not a fixed ceiling: strong demand can push BTC above it, while weak demand can cause a failed breakout.
A potential recovery becomes more convincing when Bitcoin reclaims the STH cost basis and sustains trading above it. A subsequent retest that holds as support can suggest that recent buyers are regaining confidence and that selling pressure around breakeven is being absorbed.
Investors should compare the cost basis with actual price behavior rather than assume that every crossing produces a reversal.
2. Realized Losses and Capitulation
Realized losses measure the value of coins sold below their previous on-chain acquisition cost. A sharp increase can indicate capitulation, particularly when investors who bought at higher prices exit their positions during a rapid decline.
Capitulation can contribute to market-bottom formation by transferring coins from distressed holders to buyers willing to hold them at lower prices. Once the most urgent selling has been absorbed, the market may become less vulnerable to the same source of supply.
However, a spike in realized losses does not prove that selling has finished. Further liquidations, deteriorating macroeconomic conditions, or renewed investor outflows can generate another wave of losses.
A stronger bottoming signal emerges when realized losses retreat from elevated levels, BTC stops making lower lows, and demand absorbs subsequent selling without a substantial price breakdown.
3. Spot Demand and Exchange-Traded Fund Flows
Spot demand provides an important test of whether a potential bottom has genuine buying support. If BTC stabilizes while spot-market participation improves, the market may be absorbing selling pressure rather than merely experiencing a temporary reduction in trading activity.
For institutional demand, spot Bitcoin exchange-traded fund flows can provide additional context. Persistent net inflows may support prices by indicating renewed allocation to these products, while sustained net outflows can signal weaker demand from participating investors.
ETF flows are not a complete measure of Bitcoin demand. Investors can buy BTC through exchanges, custodians, private transactions, or other vehicles that are not captured by ETF statistics. Similarly, ETF inflows do not guarantee that the broader market will rise.
The more constructive combination is improving spot demand, stabilizing prices, and reduced evidence of forced selling. If these conditions emerge while STH supply remains elevated, they may strengthen the case that the market is absorbing new supply.
4. Price Structure and Trading Volume
Price structure determines whether on-chain evidence is translating into a market reversal. A bottoming pattern becomes more credible when BTC stops establishing lower lows, breaks above a meaningful resistance level, and subsequently holds that level during a pullback.
Trading volume helps evaluate the quality of these moves. A breakout supported by stronger spot activity may indicate broader participation, whereas a move driven by thin liquidity can reverse quickly.
No single chart pattern guarantees a bottom. Bitcoin can form temporary higher lows during a broader downtrend, and a short-lived breakout may simply trigger short covering before sellers regain control.
For that reason, traders should distinguish between a possible bottom, a confirmed local trend reversal, and a longer-term recovery. The first is a hypothesis, the second requires evidence in price structure, and the third generally demands sustained confirmation across multiple time frames.
Beyond the Headlines: What KuCoin 5.0 Means for You
Market news moves fast — but where you act on it matters just as much. This October, KuCoin launches KuCoin 5.0, transforming KuCoin into a rebuilt platform. Here's what actually changes for you:
-
One account for everything. Older platforms split your money across separate "spot," "margin," and "futures" accounts and expected you to understand why. KuCoin 5.0's unified account removes that entirely — deposit once, and everything is simply there (only available to VIPs for now).
-
Stocks, indices, and commodities. KuCoin 5.0 expands beyond crypto into global markets. When crypto chops sideways and equities rally (or the reverse), you rotate in minutes instead of opening a brokerage account and waiting days for fiat rails.
-
Real-world assets (RWA). Tokenized exposure to traditional assets like commodities, right inside your crypto account. One of the fastest-growing segments in global finance is no longer reserved for institutions — you access it from the same balance you trade with.
-
Earn while you learn. Not ready to trade? KCUSD lets your stablecoins earn daily, auto-compounding interest. The lowest-stress way to put your idle deposit to work for 4% yield.
-
An AI assistant in plain language. Ask questions, get market context, understand what you're looking at — built into the platform, no jargon required.
-
An app that doesn't overwhelm. Faster, cleaner, and consistent — intuitive from the first tap, not after a tutorial.
-
Safety you can check, not just trust. A MiCAR-licensed EU entity, Proof of Reserves you can verify yourself, and internationally certified security (SOC 2 Type II, ISO 27001:2022).
Create your account in minutes — and start on the platform built for where crypto is going, not where it's been.
Conclusion
Bitcoin short-term holder supply can provide valuable insight into market participation and the behavior of recent buyers, but it should not be treated as a standalone indicator of an imminent price reversal. Trader Killa's comparison between current conditions and the 2023 recovery suggests that elevated STH supply does not necessarily imply that Bitcoin is approaching a market top. The historical analogy instead highlights the importance of understanding how holder distribution interacts with price trends and investor behavior.
Recent Glassnode data add another layer to this analysis. As of October 6, 2026, short-term holder supply in profit exceeded supply in loss, while the latest displayed STH Profit/Loss Ratio was approximately 5.33 as of October 12. These observations describe the profitability of recent holders, but they do not independently confirm that Bitcoin has established a durable bottom.
A stronger assessment requires multiple signals to align: improving price structure, a sustained recovery above the short-term holder cost basis, declining realized losses, and evidence of renewed spot demand. If these conditions fail to materialize, further downside remains possible.
Ultimately, STH supply is most useful as part of a broader analytical framework. Investors should evaluate competing scenarios, define invalidation levels, and combine on-chain evidence with price action and risk management rather than relying on a single metric or historical comparison to predict BTC's next move.
FAQs
1. Does Bitcoin short-term holder supply include coins held on exchanges?
Yes. Short-term holder supply can include coins associated with exchange wallets when the underlying data and methodology classify them accordingly. However, exchange custody and address clustering can complicate attribution, and the metric does not necessarily reveal the identity or intentions of the beneficial owners.
2. Can short-term holder supply predict Bitcoin's exact price bottom?
No. STH supply can help identify changes in market participation and provide context for potential bottoming conditions, but it cannot reliably predict an exact price or date. Traders should combine it with cost-basis levels, realized losses, demand indicators, and price structure.
3. How often should traders check Bitcoin STH supply data?
Daily observations can help active traders monitor changing market conditions, while weekly trends can reduce the risk of overreacting to short-term fluctuations. The appropriate frequency depends on the trading horizon, data availability, and the methodology used by the analytics provider.
4. Is short-term holder supply the same as Bitcoin exchange reserves?
No. STH supply classifies Bitcoin according to the estimated age of coins or holder behavior, whereas exchange reserves estimate the amount of BTC held at identified exchange addresses. The two metrics measure different aspects of the market and should not be used interchangeably.
5. Can Bitcoin reach a new low after a market-bottom signal appears?
Yes. Bottoming signals can fail when selling pressure persists, demand weakens, or broader financial conditions deteriorate. A potential bottom should be treated as a developing market hypothesis until price action and supporting indicators provide stronger confirmation.
Disclaimer: This article is for informational purposes only and does not constitute financial, legal, or investment advice. Cryptocurrency markets are volatile, and on-chain indicators cannot guarantee future price movements. Always conduct your own research before interacting with digital assets.