
Bitcoin Price Prediction 2026: Will Bitcoin Fall Under $50k After Failing at $80k?
2026/05/19 19:03:02
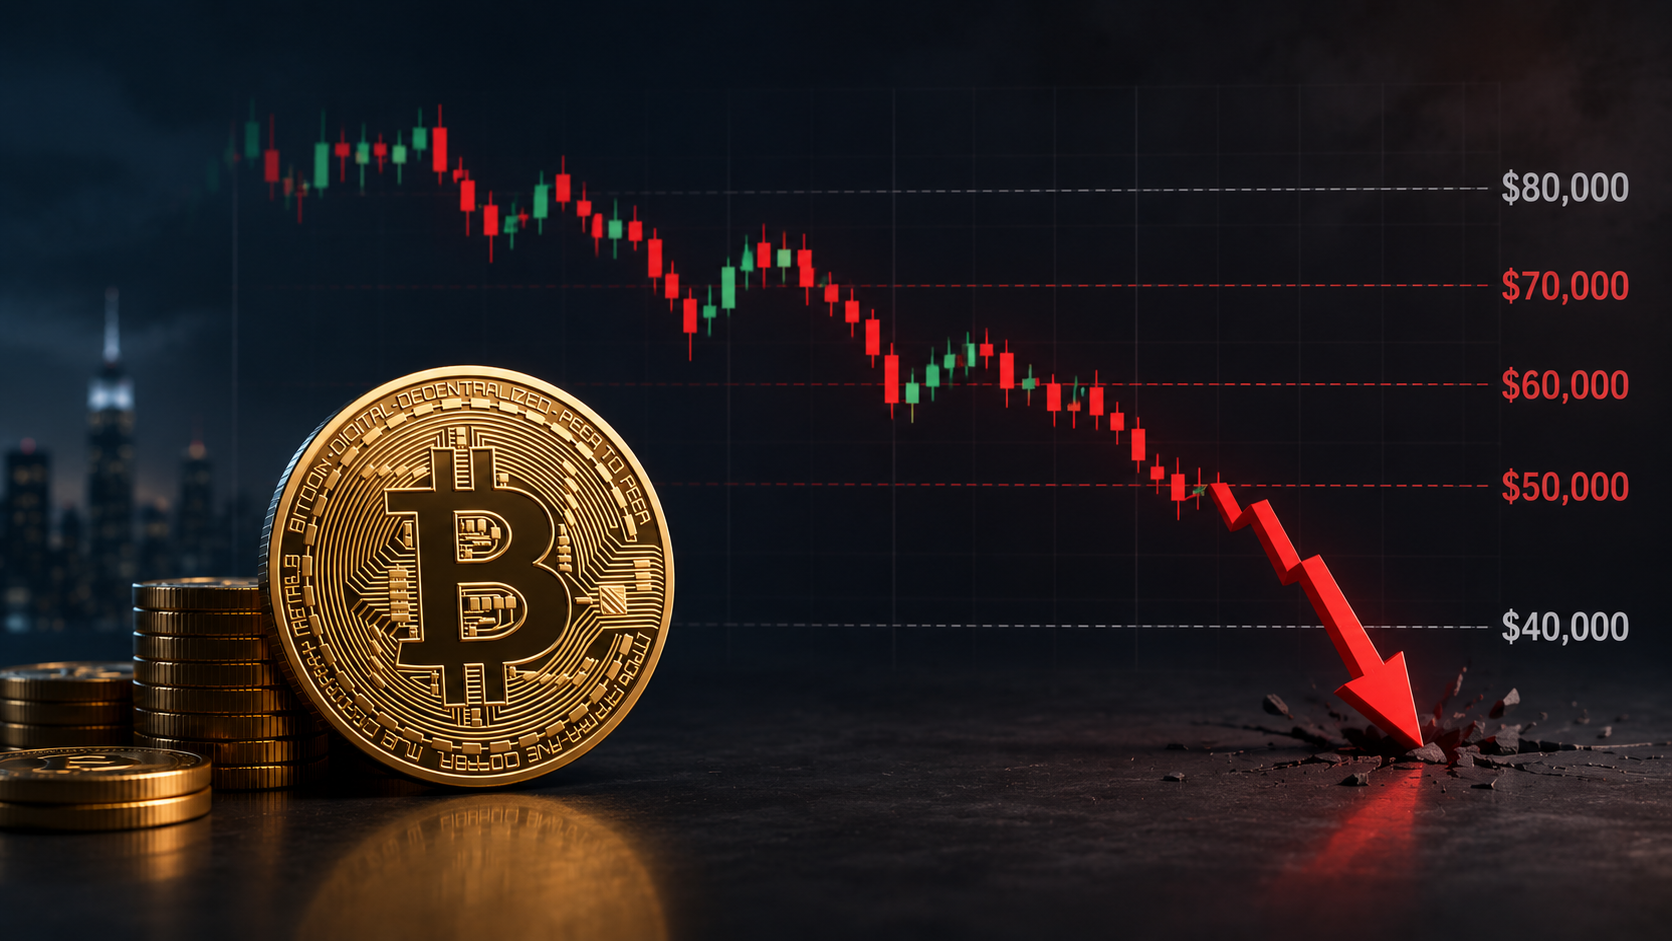
The global cryptocurrency market is facing an abrupt reality check as the Bitcoin price experiences heavy turbulence after failing to clear a massive psychological hurdle. Investors worldwide are frantically reassessing their portfolios as technical signals flash red and bearish macroeconomic developments threaten to disrupt the multi-year digital asset expansion.
This comprehensive analysis breaks down the latest market data to determine if the Bitcoin price will collapse below the crucial $50,000 baseline in 2026.
Key Takeaways
-
Psychological Rejection: The Bitcoin price faced severe exhaustion just below the $80,000 zone, rapidly flipping the $77,000–$79,000 range from a supportive launchpad into an aggressive overhead resistance barrier.
-
Sentiment Shift: The Crypto Fear and Greed Index has plummeted deep into "Fear" territory at 27/100, indicating a massive leverage wipeout and a prevailing risk-off mentality among retail participants.
-
The 41k Threat: Noted analysts are tracking an ominous four-stage collapse model, mapping a trajectory through key liquidations down to a cyclical macro bottom near $41,000.
-
ETF Cushion vs. Macro Pressures: While institutional entities like MicroStrategy and Spot ETFs offer an unprecedented structural floor, escalating Middle East tensions and sticky global inflation are draining critical market liquidity.
Market Reality Check: Analyzing the Sharp Rejection at $80,000
The digital asset ecosystem has entered a period of extreme vulnerability following Bitcoin's inability to establish a permanent foothold above the $80,000 milestone. For months, derivative traders and spot accumulators eyed this level as the ultimate confirmation of an extended structural bull run. Instead, the sudden arrival of aggressive distribution at these highs caught the market off-guard, triggering a cascade of long liquidations that rapidly deflated the asset's upward momentum.
From Support to Resistance: Why the $77k-$79k Range is Failing
The price zone stretching between $77,000 and $79,000 was widely anticipated to serve as an ironclad support band during any standard mid-cycle consolidation. However, the order books across major spot exchanges revealed a distinct lack of deep bidding interest when the asset retested these levels from above.
-
Order Book Thinning: Institutional market makers pulled liquidity bids lower, leaving the spot market highly susceptible to market orders from panicking short-term holders.
-
Futures Open Interest Inversion: Massive open interest built up during the approach to $80,000 consisted primarily of highly leveraged long positions. When the price failed to break out, these positions became a structural liability, forced to market-sell into an illiquid order book.
-
Volume Profile Validation: Volume profiles show that trading activity within the $77k–$79k cluster has shifted from accumulation to heavy distribution, confirming that smart money is taking profits and stepping aside.
The Fear Index Trigger: Dissecting the 27/100 Sentiment Drop
Market psychology can shift overnight in crypto, and the recent descent of the Crypto Fear and Greed Index to a reading of 27/100 is a stark reminder of this volatility. A drop of this magnitude signifies a complete evaporation of the retail euphoria that characterized the earlier half of the year.
When the sentiment index sits at 27, it triggers a chain reaction across the industry. Retail investors halt their automated dollar-cost averaging (DCA) programs out of fear of catching a falling knife. Concurrently, funding rates on perpetual swap markets flip neutral or negative, showing that the speculative community is actively paying premiums to open short positions, further compounding the downward pressure on the broader spot market.
The Four-Stage Collapse Theory: Inside Kabuki’s Ominous $41,000 Target
As the spot market weakens, prominent technical analysts have emerged with structural forecasts that challenge the popular "supercycle" narrative. The most notable among these is the bearish roadmap popularized by pseudonymous crypto strategist Kabuki. Known within trading circles for accurately calling previous cyclical extremes, including the multi-month accumulation bottom in late 2022 and the subsequent macro peaks, Kabuki’s latest technical model details an intricate, four-stage structural unwind that puts a sub-$50,000 Bitcoin price squarely on the table for late 2026.
Phase 1 & 2: Breaking the $61k Defense and the Dip Below $50,000
The first half of the projected collapse relies on a systematic breakdown of the primary support structures that have guarded the macro bull market for over a year.
-
Phase 1 (The $61,000 Breach): According to this model, the initial leg of major capitulation involves a clean break below the $61,000 support level. This area represents a massive cluster of realized price distribution for short-term whale accounts. If breached, it turns millions of wallets net-unprofitable, inducing a wave of panic-selling.
-
Phase 2 (The Sub-$50,000 Flush): Once $61,000 fails to hold, a lack of historical on-chain volume support creates a vacuum effect. The price is projected to slice cleanly through the psychological $50,000 mark, flushing out secondary retail stops and triggering forced liquidations among over-collateralized crypto-backed loans.
Phase 3 & 4: The $55k Dead Cat Bounce and the Ultimate $41k Bottom
The latter half of Kabuki’s thesis details the classic psychological traps that occur during extended market corrections, warning traders not to mistake brief relief rallies for true trend reversals.
Following the initial breach of $50,000 down to roughly $47,000, Phase 3 predicts an aggressive, short-squeeze-driven "dead cat bounce" back up toward $55,000. This rally will likely be driven by mainstream media declarations that the correction is over, trapping late-stage buyers. Phase 4 then initiates the final capitulation event: a grinding, low-volume sell-off that bypasses previous minor supports to establish a permanent cyclical macro bottom around $41,000, effectively cleansing the market of all remaining speculative leverage.
Why 2026 Midterm Patterns Favor the Bears
To understand why a severe correction is manifesting now, one must look beyond immediate order book dynamics and examine the overarching structural rhythms that govern the digital asset space. Historically, Bitcoin price movements have aligned with multi-year macroeconomic and political cycles. The year 2026 occupies a unique position within these behavioral frameworks, serving as a classic midterm year in global political and financial systems, which historically introduces distinct headwinds for high-risk speculative assets.
The "Sell in May" Phenomenon: Comparing 2026 to 2018 and 2022
The cryptocurrency markets have repeatedly demonstrated an inability to sustain extended bullish momentum during the middle quarters of post-halving secular cycles. This seasonality often manifests as an amplified version of the traditional financial adage, "Sell in May and go away."
-
The 2018 Precedent: Following the explosive highs of late 2017, the second quarter of 2018 saw a severe reduction in retail liquidity, marked by a systematic breakdown of key moving averages that finalized a multi-month bear market transition.
-
The 2022 Realignment: Similarly, 2022 exposed the danger of ignoring seasonal mid-cycle shifts. The second quarter initiated a massive de-leveraging event across major crypto lenders, turning minor technical breakdowns into full-scale capitulation.
-
The 2026 Conundrum: The current year is mirroring these exact structural timestamps. The rejection at $80,000 occurred precisely as seasonal liquidity dried up, indicating that institutional desks are de-risking ahead of the summer months, just as they did in previous historical cycles.
Liquidity Gaps: Identifying Hidden Long Squeeze Zones on the Chart
A technical inspection of the long-term charts reveals several structural anomalies that have left the current market structure incredibly hollow. During the rapid ascent witnessed over the past 18 months, the price leaped over several key horizontal ranges without establishing proper volume validation.
These areas, known technically as CME futures gaps and high-liquidity pools, act like financial magnets during times of market distress. Major market makers are fully aware that massive clusters of stop-loss orders belong to long traders who entered the market late during the push toward $80,000. By driving the spot price down into these illiquid zones, algorithmic trading desks can deliberately trigger these stop-losses, purchasing the liquidated assets at steep discounts while forcing a rapid, vertical flush on the charts.
Bull Trap vs. Institutional Floor: Can ETF Inflows Save BTC?
While technical chartists paint a grim picture, a powerful counter-argument exists within the structural shift in how capital enters the digital asset ecosystem. The 2026 market is fundamentally different from the speculative playgrounds of 2018 and 2022 due to the deeply entrenched presence of institutional money. This institutional paradigm introduces a continuous, regulatory-approved buying mechanism that could theoretically disrupt historical bear market dynamics and prevent a deep drop below $50,000.
The MicroStrategy Effect: Corporate Treasuries Weaponizing the Dip
Corporate adoption has graduated from speculative experimentation to a core corporate treasury strategy. Leading the charge is MicroStrategy, along with an increasing number of public corporations and private family offices that view the digital asset as a premier hedge against systemic fiat debasement.
These entities do not operate with the panic-prone mindset of retail traders; instead, they treat price dips as strategic buying opportunities. When the Bitcoin price experiences a sharp correction, these corporate treasuries deploy billions in cash reserves or issue corporate debt to accumulate spot supply directly off the market. This consistent, price-insensitive buying pressure absorbs selling volume from panicking short-term holders, effectively weaponizing market downturns to build massive long-term reserves and dampening systemic downside volatility.
Spot ETF Sticky Capital: Will Wall Street Hold the Line at $60,000?
The introduction of spot Exchange-Traded Funds (ETFs) has fundamentally altered the structural liquidity profile of the crypto market. Wealth management platforms, financial advisors, and traditional pension funds now possess a direct, friction-free avenue to allocate capital into digital assets.
| ETF Capital Metric | Retail Trading Account | Spot ETF Structure |
| Capital Source | Discretionary Speculative Income | Managed Wealth / Retirement Allocations |
| Investment Horizon | Short-Term Momentum (Days/Weeks) | Multi-Year Wealth Preservation (3-5+ Years) |
| Rejection Reaction | Panic Market Selling / Stop Out | Systematic Rebalancing / Dollar-Cost Averaging |
| Liquidity Access | Instant 24/7 Crypto Native Rails | Regulated T+1 Traditional Banking Settlement |
Data tracking net asset value flows across major spot ETFs demonstrates that institutional capital is far "stickier" than native crypto capital. Even as prices retreated from the $80,000 resistance level, net outflows remained remarkably muted compared to historical corrections. This suggests that traditional Wall Street investors view the $60,000 region as an attractive valuation tier, presenting a massive structural wall of buying power that could prevent a deeper descent into sub-$50,000 territory.
How Broader Markets Are Accelerating the Slump
No digital asset exists in a vacuum, and the systemic health of the broader cryptocurrency ecosystem plays a vital role in determining the price trajectory of the market leader. Currently, the major altcoin networks are flashing signs of intense structural exhaustion. When secondary layer-1 networks and decentralized finance protocols suffer massive capital outflows, it creates an adverse feedback loop that inevitably drags down the primary asset as investors liquidate cross-margin positions to cover losses.
Why ETH Outflows Threaten Bitcoin’s Stability
Ethereum has long served as the economic foundation for the decentralized application ecosystem, making its financial health a leading indicator for the broader market. Unfortunately, recent data reveals a sustained wave of net capital outflows from Ethereum native smart contracts and associated spot investment vehicles.
This institutional and protocol-level exit from ETH places a direct strain on the Bitcoin price. As large-scale multi-asset funds experience redemptions within their Ethereum tranches, managers are frequently forced to liquidate portions of their highly liquid Bitcoin holdings to maintain predetermined risk parameters and portfolio balance. This cross-asset contagion transforms localized weakness within the smart contract sector into systemic selling pressure across the entire digital asset landscape.
Solana’s 50% Ominous Pattern: What Peter Brandt’s Alert Means for BTC
Adding fuel to the bearish fire are warnings from legacy market technical analysts regarding the health of alternative layer-1 ecosystems. Veteran trader Peter Brandt recently highlighted an ominous technical pattern forming on the Solana charts, projecting a potential 50% price drop for the high-throughput network.
A technical failure of that magnitude for an ecosystem as large as Solana would have immediate consequences for the premier cryptocurrency. When a primary market darling collapses by 50%, it triggers a massive wave of margin calls across global derivatives platforms. Traders who are underwater on their altcoin long positions are forced to market-sell their premier assets—primarily Bitcoin—to preserve their accounts, accelerating the broader market slump and threatening key macro supports.
Macro Black Swans: Geopolitics and Interest Rates in Late 2026
Beyond technical charts and internal market structure lies the inescapable reality of global macroeconomics. For years, crypto proponents argued that decentralized assets would act as non-correlated safe havens during periods of geopolitical and macroeconomic instability. However, the actual market data from 2026 continues to demonstrate that under extreme systemic stress, digital assets behave firmly as high-beta risk-on assets, highly sensitive to global liquidity shifts.
Middle East Tensions: Why Crypto is Behaving as a Risk-Off Asset
The ongoing geopolitical instability in the Middle East has injected a heavy dose of uncertainty into global financial markets, with immediate consequences for digital asset valuations.
-
Flight to Traditional Liquidity: When geopolitical conflicts escalate, institutional capital allocators immediately prioritize absolute capital preservation, transferring wealth out of digital assets and into traditional risk-off instruments like US Treasury bonds and physical gold.
-
Algorithmic Risk Reduction: High-frequency quantitative trading desks operate on global risk parity models. The moment geopolitical risk metrics spike, these automated systems universally reduce exposure across all volatile assets, initiating immediate sell orders on spot crypto exchanges regardless of internal crypto fundamentals.
-
Energy Cost Pressures: Escalating regional conflicts threaten global supply chains and energy infrastructure. Rising oil prices increase operational costs for industrial-scale proof-of-work mining facilities, forcing miners to sell a higher percentage of their newly minted supply to cover immediate overhead costs.
Will Delayed Fed Rate Cuts Crush Crypto Liquidity?
The macroeconomic headwind most directly impacting the 2026 crypto market is the persistence of global inflation metrics. Despite aggressive tightening cycles executed by global central banks, consumer price indices remain stubbornly elevated, completely disrupting the market's anticipated interest rate trajectory.
With the Federal Reserve forced to maintain elevated interest rates far longer than initial consensus estimates suggested, the cost of capital remains prohibitively high. This environment drains speculative capital out of the financial system, as institutional investors can safely capture yields exceeding 5% in risk-free sovereign debt rather than risking capital in highly volatile digital currency markets. Without the influx of cheap credit and expansionary central bank liquidity, sustaining an asset price above $80,000 becomes a structural impossibility, leaving the market highly vulnerable to downside retests.
Crucial Support Levels to Watch in 2026
As market crosscurrents intensify, technical traders must look past market noise and monitor the exact horizontal and dynamic price levels where major institutional order blocks reside. These levels represent the definitive lines in the sand where buyers must step in to prevent a complete breakdown of the multi-year market structure.
The $70,000 Line in the Sand: First Major Defense for Bulls
The $70,000 territory is the primary operational base for short-term trend followers and momentum traders. This level aligns with critical short-term exponential moving averages and represents the average entry price for a massive cohort of swing traders who entered the market during the late Q1 breakouts.
Should the price experience a weekly close below $70,000, it would signal a structural shift from a standard corrective pullback to a confirmed medium-term markdown phase. Defensive buy walls at this level are expected to be highly active initially, as automated market-maker algorithms attempt to defend their positions, making it the first vital battleground between bulls and bears.
The Last Barrier Before the $50k Drop
If the $70,000 psychological boundary fails to hold the line, all technical focus shifts immediately to the absolute macro defense zone located at $60,000. This area is reinforced by several overlapping technical and on-chain metrics:
The $60,000 level represents the true dividing line between a healthy, volatile bull market consolidation and the initiation of a secular macro bear market. Because so much institutional capital is anchored around this price point, a clean, high-volume breakdown below $60,000 would invalidate almost all prevailing bullish models. This event would open the technical floodgates, exposing a massive structural vacuum that would likely drag the asset down below $50,000 in short order.
How to Manage Risk on Our Exchange
Navigating a highly volatile environment requires access to sophisticated, professional-grade trading infrastructure that prioritizes capital preservation and execution speed. Our exchange platform is engineered specifically to empower traders to manage risk effectively during violent multi-stage market corrections. By utilizing advanced order types—such as trailing stop-losses, trigger-based OCO (One-Cancels-the-Other) structures, and isolated margin modes—traders can precisely insulate their core portfolios from sudden downside liquidations.
Furthermore, our comprehensive market suite provides deep liquidity pools and institutional-grade order matching, ensuring your trades execute with minimal slippage even during moments of peak market panic. Whether you choose to hedge your spot allocations using our liquid quarterly futures contracts, deploy automated grid trading bots to capitalize on horizontal ranges, or accumulate stablecoin yields while waiting for a confirmed macro bottom, our platform delivers the security, reliability, and technological edge required to transform market volatility into structured trading opportunities.
Conclusion
Predicting the macro trajectory of the digital asset market requires balancing immediate technical weaknesses against long-term structural changes. While short-term metrics—such as the rejection at $80,000 and shifting global sentiment—suggest a real risk of a drop toward the $50,000 boundary, the continuous accumulation from spot ETFs and corporate treasuries provides a powerful counter-weight. Ultimately, the Bitcoin price in 2026 will be decided by whether macro liquidity pressures can break this historic institutional floor, making strict risk management essential for all market participants.
FAQ
Q1: What is the current prediction for the Bitcoin price in late 2026?
A: Analysts are deeply divided, with bearish models predicting a multi-stage correction down to the $41,000 region, while institutional forecasters maintain an average baseline projection of around $82,000, assuming key macro supports hold.
Q2: Why did the Bitcoin price fail to break above the $80,000 mark?
A: The failure at $80,000 was primarily driven by a massive build-up of over-leveraged long positions in derivative markets, which encountered aggressive institutional profit-taking and an illiquid spot order book.
Q3: Will global inflation and interest rates cause the Bitcoin price to crash?
A: Yes, if inflation remains stubbornly elevated throughout the year, the Federal Reserve will likely delay interest rate cuts, keeping capital costs high and draining the liquidity required to sustain higher digital asset valuations.
Q4: How does the Crypto Fear and Greed Index affect market liquidations?
A: When the index drops to 27/100 (Fear), it reflects widespread panic. This psychological shift often triggers retail capitulation and cascade liquidations, as leveraged positions are forced to close into falling bids.
Q5: Can spot ETF inflows prevent Bitcoin from falling under $50k in 2026?
A: Spot ETFs provide a massive structural safety net of sticky, long-term capital that heavily defends the $60,000 range, making a drop below $50,000 unlikely unless a severe global macroeconomic crisis occurs.