

Bitcoin Price Analysis: CryptoQuant Identifies $88,350-$89,200 Holder Cost Cluster
Introduction
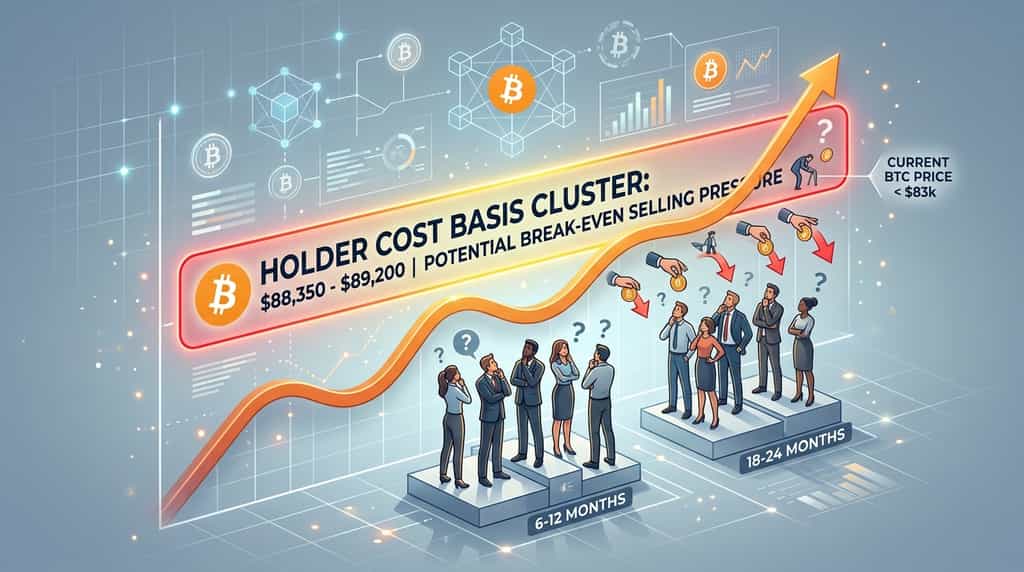
Bitcoin's next major market test may come from investor behavior rather than a conventional technical resistance level. On October 2, 2026, CryptoQuant analyst Darkfost highlighted a concentration of Bitcoin holder cost bases between $88,350 and $89,200, where investors who bought BTC at different points in the previous two years could reconsider their positions. This range matters because holders who have experienced prolonged unrealized losses may choose to sell when prices approach their original purchase levels, potentially increasing selling pressure during a recovery.
The key distinction is that a holder cost cluster is not a guaranteed price ceiling. It is an on-chain indicator of where investor reactions may influence market momentum. Understanding this distinction can help traders assess Bitcoin price resistance, interpret holder profitability, and evaluate whether a recovery has sufficient strength to continue.
As of October 9, Bitcoin is trading below the identified range, making the $88,350-$89,200 zone a potential future test rather than a resistance level that the market is currently touching. According to CoinGecko's historical market data, BTC closed at $83,282 on October 7, illustrating the distance between the market price and the reported holder cost cluster.
What Is the Bitcoin Holder Cost Cluster Near $89,000?
The $88,350-$89,200 Bitcoin holder cost cluster represents the estimated average acquisition prices of two distinct groups of BTC holders, rather than a price level established by technical chart patterns. According to the October 2 analysis attributed to CryptoQuant analyst Darkfost, the 18-month-to-two-year holder cohort had a cost basis of approximately $88,350, while the six-to-12-month cohort had a cost basis of approximately $89,200. These closely positioned averages create a potential area of concentrated investor decision-making if Bitcoin returns to the range.
A holder's cost basis estimates the price at which the holder acquired Bitcoin. When BTC trades below that level, the position is generally at an unrealized loss; when it trades above it, the position is generally at an unrealized profit. These are estimates of aggregate cohort profitability, not guarantees about the profitability of every individual wallet, because each investor may have purchased BTC at a different price.
The distinction between the two cohorts is important. Investors who purchased Bitcoin six to 12 months earlier may have entered during a different market phase from investors who acquired it 18 to 24 months earlier. Their willingness to hold, sell, or accumulate more BTC may therefore differ when the market approaches their respective break-even levels.
The cluster is consequently best understood as a potential risk zone. It highlights where selling pressure could emerge, but it does not establish that Bitcoin must reverse at $89,000 or that the price cannot move above it.
Why Could the $88,350-$89,200 Range Create Selling Pressure?
Bitcoin could face selling pressure near $89,000 because some holders may use a recovery toward their acquisition prices as an opportunity to exit positions that have remained underwater. This behavior is often described as break-even selling: investors who have experienced losses may become more willing to sell once the market price approaches the amount they originally paid.
The six-to-12-month cohort is particularly relevant to the October 2 analysis. Darkfost noted that this group had been broadly underwater for close to a year, creating a possible incentive for some investors to reduce exposure as Bitcoin approaches their average cost basis. Investors who bought during a previous market peak may prioritize recovering their capital rather than waiting for a larger rally.
Several behaviors could emerge around the cluster:
-
Break-even exits: Some holders may sell BTC once their positions approach their estimated purchase prices, increasing the amount of Bitcoin offered to the market.
-
Continued accumulation: Other holders may view the recovery as confirmation of improving conditions and buy more Bitcoin, potentially lowering their average acquisition cost.
-
Position retention: Investors with longer time horizons may decide that short-term price fluctuations do not justify selling, limiting the amount of additional supply entering the market.
The actual price response depends on the balance between these behaviors and fresh demand. If sell orders from holders near break-even are absorbed by buyers, Bitcoin could move through the zone. If selling exceeds available demand, the recovery could lose momentum or reverse.
Importantly, an investor's cost basis does not reveal their intentions. On-chain analysis can identify potential areas of behavioral pressure, but it cannot establish how many investors will sell, how much BTC they will distribute, or whether their orders will materially affect market prices.
How Do Holder Cost Bases Work in On-Chain Analysis?
Holder cost bases help analysts estimate the average acquisition price of Bitcoin held by specific groups, allowing them to assess whether those investors are generally in profit or loss. Unlike conventional technical indicators, which primarily analyze price and trading activity, on-chain cost-basis metrics use blockchain-related information to study the economic position of holders.
What Is a Realized Price?
Realized price is a commonly used on-chain metric that estimates the average acquisition cost of Bitcoin represented by the relevant circulating supply. It is generally calculated by dividing the realized capitalization of that supply by the number of BTC included in the calculation.
Realized capitalization differs from conventional market capitalization. Market capitalization values circulating BTC at the current market price, while realized capitalization values coins according to the price at which they last moved on-chain, subject to the methodology used by the data provider.
Realized price can therefore help analysts evaluate whether the market price is above or below an estimated aggregate acquisition cost. However, a coin's last on-chain movement does not necessarily represent a new purchase on an exchange. Transfers between wallets, custody changes, and other blockchain transactions can affect how realized-value metrics should be interpreted.
Why Does Holder Age Matter?
Holder age adds context because investors who acquired Bitcoin at different times may have different cost bases, expectations, and reactions to market volatility. On-chain analytics platforms can segment supply according to how long coins have remained unmoved or according to defined holding-period cohorts.
In the October 2 analysis, the distinction between six-to-12-month holders and 18-month-to-two-year holders revealed two separate cost-basis estimates concentrated within an $850 price interval. That narrow range is notable because a recovery into it could bring both groups closer to their estimated break-even levels at approximately the same time.
Nevertheless, holding duration is not the same as investor identity or conviction. A wallet that has held BTC for 18 months may belong to a long-term investor, a custodian, or an entity managing assets for multiple clients. A coin's age alone cannot establish an owner's intentions or financial circumstances.
How Is a Holder Cost Cluster Different From Technical Resistance?
A holder cost cluster reflects potential selling or buying behavior associated with acquisition prices, whereas technical resistance is identified through price-chart analysis, such as previous highs, repeated rejections, or areas where sellers have historically overwhelmed buyers.
The two concepts can overlap. If Bitcoin approaches a cost-basis cluster that also coincides with a previous price high or a heavily traded area, several independent sources of selling pressure may converge. Such an overlap can make the zone more relevant to traders, although it still does not guarantee a rejection.
The $88,350-$89,200 range should not automatically be treated as a technical resistance level simply because many holders may approach break-even there. Its significance depends on how the market actually responds when price reaches the range.
What Could Happen If Bitcoin Reaches the $88,350-$89,200 Cluster?
Bitcoin's reaction to the holder cost cluster will depend on whether incoming demand can absorb any selling from investors approaching break-even. Three broad scenarios can help explain the possible outcomes without assuming that any one is certain.
Scenario 1: Bitcoin Breaks Above the Cluster
A sustained move above $89,200 could indicate that buyers are absorbing the supply offered by holders near their estimated cost bases. If Bitcoin also maintains its position above the range during subsequent retests, the former risk zone may become less important as a source of immediate selling pressure.
However, a brief intraday move above the cluster would provide weaker evidence than a sustained breakout supported by broader market participation. Traders could examine spot trading volume, price structure, and relevant on-chain distribution metrics to determine whether demand is broadening or whether the move is vulnerable to reversal.
A breakout would not prove that all underwater holders had sold or that the market had entered a new bull phase. It would simply show that the price had moved through the identified zone under the prevailing market conditions.
Scenario 2: Bitcoin Is Rejected Near $89,000
A rejection near the cluster could indicate that selling pressure is temporarily exceeding demand. Investors who have waited months to recover their capital may use a price rebound to exit, while short-term traders may respond to the same area as a potential resistance zone.
If Bitcoin repeatedly fails to hold above the range, traders may look for evidence of weakening momentum, lower highs, or increased selling volume. Those observations would help distinguish a meaningful rejection from a brief pause in an otherwise strengthening market.
Even then, a rejection would not necessarily signal a prolonged bearish trend. Selling could be temporary, and renewed demand could bring Bitcoin back toward the zone. Confirmation would require additional evidence from price action and market participation.
Scenario 3: Bitcoin Consolidates Below the Cluster
Bitcoin could also remain below $88,350 without either breaking out or undergoing a sharp reversal. Consolidation would allow market participants to reassess their positions while buyers and sellers establish a new short-term equilibrium.
During such a phase, the quality of demand matters more than the proximity of price to a single on-chain level. Traders could monitor whether spot buying remains consistent, whether market volatility contracts, and whether the price forms a stronger base or continues to produce lower highs.
Consolidation is not inherently bullish or bearish. Its significance depends on how the price eventually leaves the range, the strength of that move, and whether supporting indicators confirm the direction.
Beyond the Headlines: What KuCoin 5.0 Means for You
Market news moves fast — but where you act on it matters just as much. This October, KuCoin launches KuCoin 5.0, transforming KuCoin into a rebuilt platform. Here's what actually changes for you:
-
One account for everything. Older platforms split your money across separate "spot," "margin," and "futures" accounts and expected you to understand why. KuCoin 5.0's unified account removes that entirely — deposit once, and everything is simply there (only available to VIPs for now).
-
Stocks, indices, and commodities. KuCoin 5.0 expands beyond crypto into global markets. When crypto chops sideways and equities rally (or the reverse), you rotate in minutes instead of opening a brokerage account and waiting days for fiat rails.
-
Real-world assets (RWA). Tokenized exposure to traditional assets like commodities, right inside your crypto account. One of the fastest-growing segments in global finance is no longer reserved for institutions — you access it from the same balance you trade with.
-
Earn while you learn. Not ready to trade? KCUSD lets your stablecoins earn daily, auto-compounding interest. The lowest-stress way to put your idle deposit to work for 4% yield.
-
An AI assistant in plain language. Ask questions, get market context, understand what you're looking at — built into the platform, no jargon required.
-
An app that doesn't overwhelm. Faster, cleaner, and consistent — intuitive from the first tap, not after a tutorial.
-
Safety you can check, not just trust. A MiCAR-licensed EU entity, Proof of Reserves you can verify yourself, and internationally certified security (SOC 2 Type II, ISO 27001:2022).
Create your account in minutes — and start on the platform built for where crypto is going, not where it's been.
Conclusion
CryptoQuant analyst Darkfost's October 2, 2026, analysis identified a Bitcoin holder cost cluster between $88,350 and $89,200, based on the estimated acquisition prices of investors holding BTC for six to 12 months and 18 months to two years. The range matters because a recovery toward these levels could encourage some underwater holders to sell near break-even, potentially creating additional supply that the market must absorb.
However, the cluster is a potential behavioral risk zone, not a fixed technical resistance level or a reliable standalone price prediction. Bitcoin could break above the range if demand absorbs selling pressure, experience a rejection if sellers dominate, or consolidate below it while market participants reassess their positions. Each outcome requires confirmation from actual price behavior.
Traders should combine holder cost-basis analysis with spot trading volume, exchange netflows, realized profit and loss, and derivatives positioning. They should also distinguish historical observations from current market conditions, since both Bitcoin's price and cohort cost bases can change over time.
Ultimately, the $89,000 area is useful as a reference point for evaluating investor behavior, not as a guarantee of Bitcoin's next direction. A disciplined approach should prioritize updated data, risk management, and independent confirmation over any single on-chain signal.
FAQs
1. What is Bitcoin's realized price?
Bitcoin's realized price is an on-chain metric that estimates the average acquisition price of BTC within a defined supply. It is generally derived by dividing realized capitalization by the corresponding circulating supply. It differs from the current market price and should be interpreted according to the data provider's methodology.
2. What is the difference between short-term and long-term Bitcoin holders?
Short-term and long-term holders are categories defined by holding duration or coin age, depending on the analytics provider. Shorter holding periods can capture more recent market participants, while longer holding periods can help analysts study the behavior of more established holdings. These classifications do not necessarily identify individual investors or reveal their intentions.
3. Can on-chain data show whether a specific Bitcoin investor is selling?
No. Public blockchain data can show transactions between addresses, but it generally cannot establish the real-world identity of an address owner or the reason for a transfer. Analysts use aggregated metrics to infer possible market behavior, but those interpretations remain subject to uncertainty.
4. Does a Bitcoin breakout above resistance confirm a new bull market?
No. A breakout may indicate strengthening demand, but it does not independently confirm a new bull market. Traders typically assess whether the move is sustained and supported by broader evidence, including market participation, trend structure, and relevant on-chain indicators.
5. Is Bitcoin holder cost-basis analysis useful for long-term investors?
Yes. Holder cost-basis analysis can provide context about aggregate investor profitability and potential selling pressure. Long-term investors can use it alongside fundamental research, portfolio allocation, and risk management, but should not treat any individual cost-basis level as a guaranteed buy or sell signal.
Disclaimer: This article is for informational purposes only and does not constitute financial, legal, or investment advice. Cryptocurrency markets are volatile, and digital asset trading involves substantial risk, including the possible loss of your entire investment. Always conduct your own research before interacting with digital assets.