

Bitcoin Falls Below $70,000 as Analyst Flags Extreme Undervaluation Seen Just 3.4% of the Time

Introduction
Bitcoin price has continued to decline following President Donald Trump's midterm election defeat, falling below $70,000 and approaching $68,000 on November 13, 2026. The cryptocurrency had become closely associated with Trump's political agenda and his public support for the digital asset industry. As a result, the Republican Party's loss of control of Congress has weakened a narrative that had supported expectations of a more favorable US crypto policy environment. Although the election was not the only factor behind the sell-off, the political shift has added to market uncertainty.
At the same time, a valuation signal highlighted by CryptoQuant analyst Darkfost suggests that Bitcoin has entered an extremely undervalued zone observed during only approximately 3.4% of its historical record. The current price is also approaching the lower boundary of the Bitcoin power-law model, which is around $68,000 on the referenced chart. These two signals raise an important question: is Bitcoin approaching a historically significant valuation area that could provide support, or does the ongoing correction still have further to run?
Quick Answer: Is Bitcoin Undervalued Below $70,000?
Bitcoin is showing signs of historical undervaluation under a CryptoQuant valuation framework, while the $68,000 area is a notable long-term reference level under the referenced power-law model. Neither signal, however, confirms that the market has reached a bottom.
-
Rare valuation condition: CryptoQuant analyst Darkfost reported that the current extreme undervaluation reading has appeared during approximately 3.4% of Bitcoin's historical record.
-
Price approaching $68,000: Bitcoin fell below $70,000 on November 13, trading near the lower-$68,000 range.
-
Power-law reference: The $68,000 area is close to the lower boundary displayed by the referenced Bitcoin power-law model, potentially making it a level worth monitoring.
-
Political and macroeconomic pressure: Trump's midterm election defeat, uncertainty over US crypto policy, institutional fund flows, and broader risk aversion have contributed to market weakness.
-
No confirmed bottom: Historical valuation signals and model-based price boundaries provide analytical context, not a guarantee of a price rebound.
Why Did Bitcoin Fall After Trump's Midterm Election Defeat?
Bitcoin's decline reflects a shift in political expectations as well as broader financial-market pressure. The US midterm election result challenged a political narrative that had become closely connected to Bitcoin's market performance.
Trump's public support for cryptocurrency had helped establish expectations of a more favorable regulatory environment in the United States. His administration's digital asset agenda, including its stated support for the industry, became an important part of the broader Bitcoin investment narrative. For some market participants, the prospect of supportive legislation and a more accommodating regulatory approach was one reason to expect continued institutional participation.
The Republican Party's midterm election defeat changed that outlook. With Democrats gaining control of Congress, the legislative environment for the remaining two years of Trump's term became less predictable. Crypto-related bills and other industry initiatives may face additional negotiations, political scrutiny, or delays. This does not necessarily mean that US crypto policy will reverse, but it does introduce uncertainty around the speed and direction of future policy developments.
Bitcoin had therefore become exposed to a political expectation that extended beyond its underlying network fundamentals. When that expectation weakened, it added another source of uncertainty to an already fragile market.
However, the election result should not be treated as the sole explanation for Bitcoin's decline. The cryptocurrency initially experienced a rebound after the election before losing momentum. Its subsequent fall below $70,000 also coincided with broader selling across risk-sensitive assets, concerns about monetary policy, and changes in institutional investment flows.
What Does CryptoQuant's 3.4% Extreme Undervaluation Signal Mean?
The 3.4% reading indicates that Bitcoin has entered a valuation condition that has been relatively uncommon in the historical data examined by CryptoQuant analyst Darkfost.
According to the analysis referenced in the original post, Darkfost observed that Bitcoin had moved into an extreme undervaluation zone after its latest decline. Comparable conditions reportedly accounted for approximately 3.4% of the historical period covered by the indicator.
This figure describes historical frequency. It does not mean Bitcoin has a 3.4% chance of falling further, nor does it imply a 96.6% probability of a rebound. Rather, it suggests that the valuation condition currently being observed has occurred relatively infrequently under the methodology used.
The underlying concept is the difference between market price and estimated value. A falling price does not automatically mean that an asset is undervalued. Valuation indicators attempt to compare the current market price with a reference measure, which may incorporate historical price behavior, network activity, investor cost bases, or other on-chain information. When the market price falls significantly below the relevant reference level, the indicator may classify the asset as undervalued.
Is $68,000 a Potential Support Level Under Bitcoin's Power-Law Model?
The area around $68,000 is a significant long-term reference point in the power-law model cited for this analysis. Since Bitcoin is approaching the model's lower boundary, this price area may attract attention as a potential support zone. However, a model-based boundary is not equivalent to confirmed market support.
Bitcoin's power-law model uses a mathematical relationship between the asset's price and elapsed time to describe its long-term historical trend. Some versions of the model display upper and lower boundaries around the central trend line. These bands allow analysts to assess whether the current market price is relatively high or low compared with the model's historical range.
The CoinGlass Bitcoin Power Law chart provides a visual reference for this framework. On the referenced chart, the lower boundary is around $68,000. Bitcoin's decline toward this area therefore brings the model's lower range into focus.
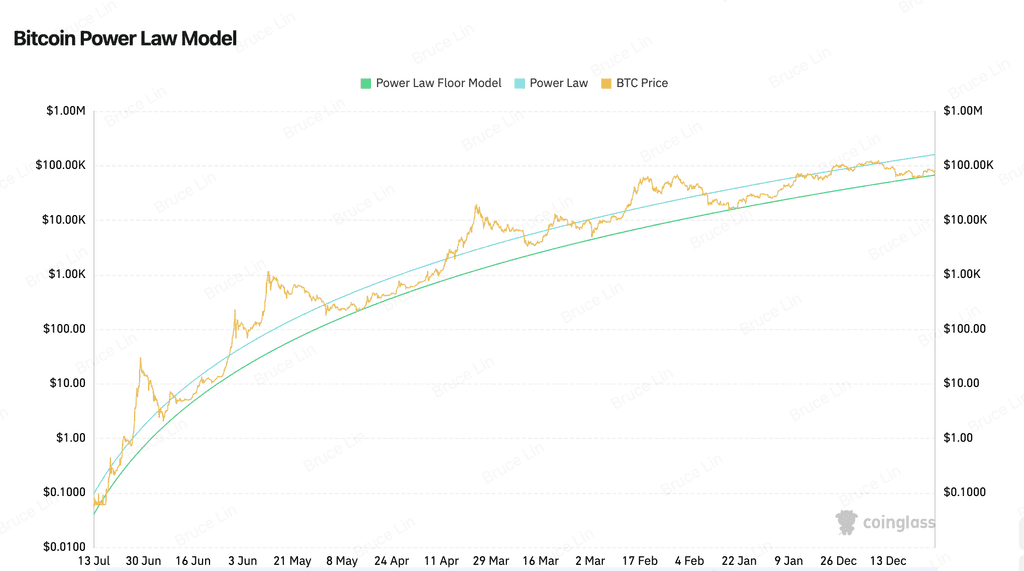
Source: Coinglass, as of November 13, 2026
If Bitcoin stabilizes near this level, the price action could suggest that the market is approaching a historically low valuation area under the selected model. The level may also overlap with other technical reference points, making it relevant to analysts monitoring the correction.
There are, however, important limitations. The exact lower boundary depends on the model's data series, fitting period, mathematical parameters, and calculation method. Different implementations of a power-law model can produce different values. The $68,000 figure should therefore be treated as an approximate reference level from the selected chart, not a universally established price floor.
Which Indicators Could Confirm Whether Bitcoin Is Stabilizing?
Whether Bitcoin can establish support near $68,000 will depend on whether market demand becomes strong enough to absorb ongoing selling pressure. Several indicators can help assess whether the correction is losing momentum.
Spot-market demand: Sustained spot buying would provide stronger evidence of demand than a temporary rebound driven mainly by derivatives. Trading volume and the balance between aggressive buyers and sellers can help reveal whether market participants are returning.
Bitcoin ETF flows: Net inflows into spot Bitcoin ETFs may indicate renewed institutional allocation. Persistent outflows, on the other hand, could suggest that institutional demand remains weak. ETF flows should be considered alongside activity in the broader spot market.
Derivatives positioning: Open interest, funding rates, and liquidation data can reveal whether excessive leverage is contributing to volatility. A reduction in leveraged positions may make the market less vulnerable to forced selling, although lower leverage alone does not guarantee a recovery.
On-chain holder behavior: Metrics such as realized price, long-term holder supply, and exchange flows can provide information about investor activity. Increased transfers to exchanges may warrant attention because they can precede selling, although not every exchange deposit results in an immediate sale.
Macroeconomic conditions: US inflation data, Treasury yields, the dollar, and Federal Reserve policy expectations remain important variables. A more favorable liquidity environment could support risk appetite, while tighter financial conditions may continue to weigh on speculative assets.
A more convincing stabilization would involve several of these indicators improving together. A brief recovery above $70,000 or a single undervaluation reading would not, by itself, establish that Bitcoin's broader market trend has reversed.
Conclusion
Bitcoin's decline below $70,000 has brought two long-term valuation signals into focus. CryptoQuant analyst Darkfost's reported 3.4% historical frequency suggests that Bitcoin has entered an unusually depressed valuation condition under the framework being monitored. Meanwhile, the area around $68,000 is close to the lower boundary displayed by the referenced power-law model, making it a potentially important level for market analysis.
The political shift following Trump's midterm election defeat has weakened expectations surrounding the US crypto policy outlook, while macroeconomic pressure, institutional flows, and derivatives positioning have added to selling pressure. These factors help explain why Bitcoin has struggled to recover, even as long-term valuation indicators point to historically low levels.
Neither the 3.4% reading nor the power-law boundary confirms that a market bottom is in place. A durable recovery would require evidence that spot demand is returning and selling pressure is easing. The key distinction is between historical undervaluation and a confirmed reversal: Bitcoin may be approaching a significant long-term reference area, but the duration and depth of the correction remain uncertain.
FAQs
-
Why did Bitcoin fall below $70,000 in November 2026?
Bitcoin fell below $70,000 amid changing political expectations after Trump's midterm election defeat, tighter financial conditions, weaker institutional flows, and selling pressure across risk-sensitive markets. Leveraged liquidations may also have amplified the decline.
-
What does CryptoQuant's 3.4% undervaluation reading mean?
The figure means that comparable extreme undervaluation conditions appeared during approximately 3.4% of the historical observations considered by analyst Darkfost. It is a historical frequency, not the probability of an imminent rebound.
-
Is Bitcoin undervalued at $68,000?
Some long-term valuation frameworks may classify Bitcoin as undervalued near this level. However, the conclusion depends on the model and its assumptions, and a low valuation does not prevent further price declines.
-
What is the Bitcoin power-law model?
The Bitcoin power-law model is a statistical framework that fits a long-term mathematical relationship between Bitcoin's price and elapsed time. Some versions use upper and lower boundaries to illustrate how far the market price deviates from the fitted trend.
-
Can the $68,000 power-law boundary act as Bitcoin support?
The $68,000 area may serve as a long-term valuation reference and a potential support zone, but it is not guaranteed to hold. Actual support depends on market demand, liquidity, and investor behavior.
Disclaimer
This general market information, possibly from third-party, commercial, or sponsored sources, is provided for reference and educational purposes only and does not constitute financial or investment advice, an offer, solicitation, or guarantee. We disclaim liability for its accuracy, completeness, reliability, and any resulting losses. Investments/trading are risky; past performance doesn’t guarantee future results. Users should research, judge prudently, and take full responsibility. For further details, please consult KuCoin’s Terms of Use and Risk Disclosure.