


Weekly Technical Overview: Bitcoin At Its Critical Support Level ($42,000) | Can The Bulls Takeover From Here?

The prices of Bitcoin and its altcoin peers continue to move under pressure, with sellers knocking down buyers at every critical price level. 2022 started on a much different note for the crypto market than its situation at the beginning of 2021.

Source: Alternative.me
Currently, the Fear & Greed Index value is at 23, indicating Extreme Fear. This number was much worse (10) during the weekend. Contrarily, the same index was at 93 (Extreme Greed) at the beginning of 2021. As the BTC market is yet to seek a clear direction, the possibility of a new bear run could be a potential reason for this depressing trader sentiment.
Is Bitcoin Losing Its Dominance?
The prolonged downtrend in the Bitcoin asset class, now trading at around $42,000, has also impacted its dominance in the crypto world. From the highs of close to 70% in January 2021, Bitcoin dominance has plummeted to a mere 40% as of writing.
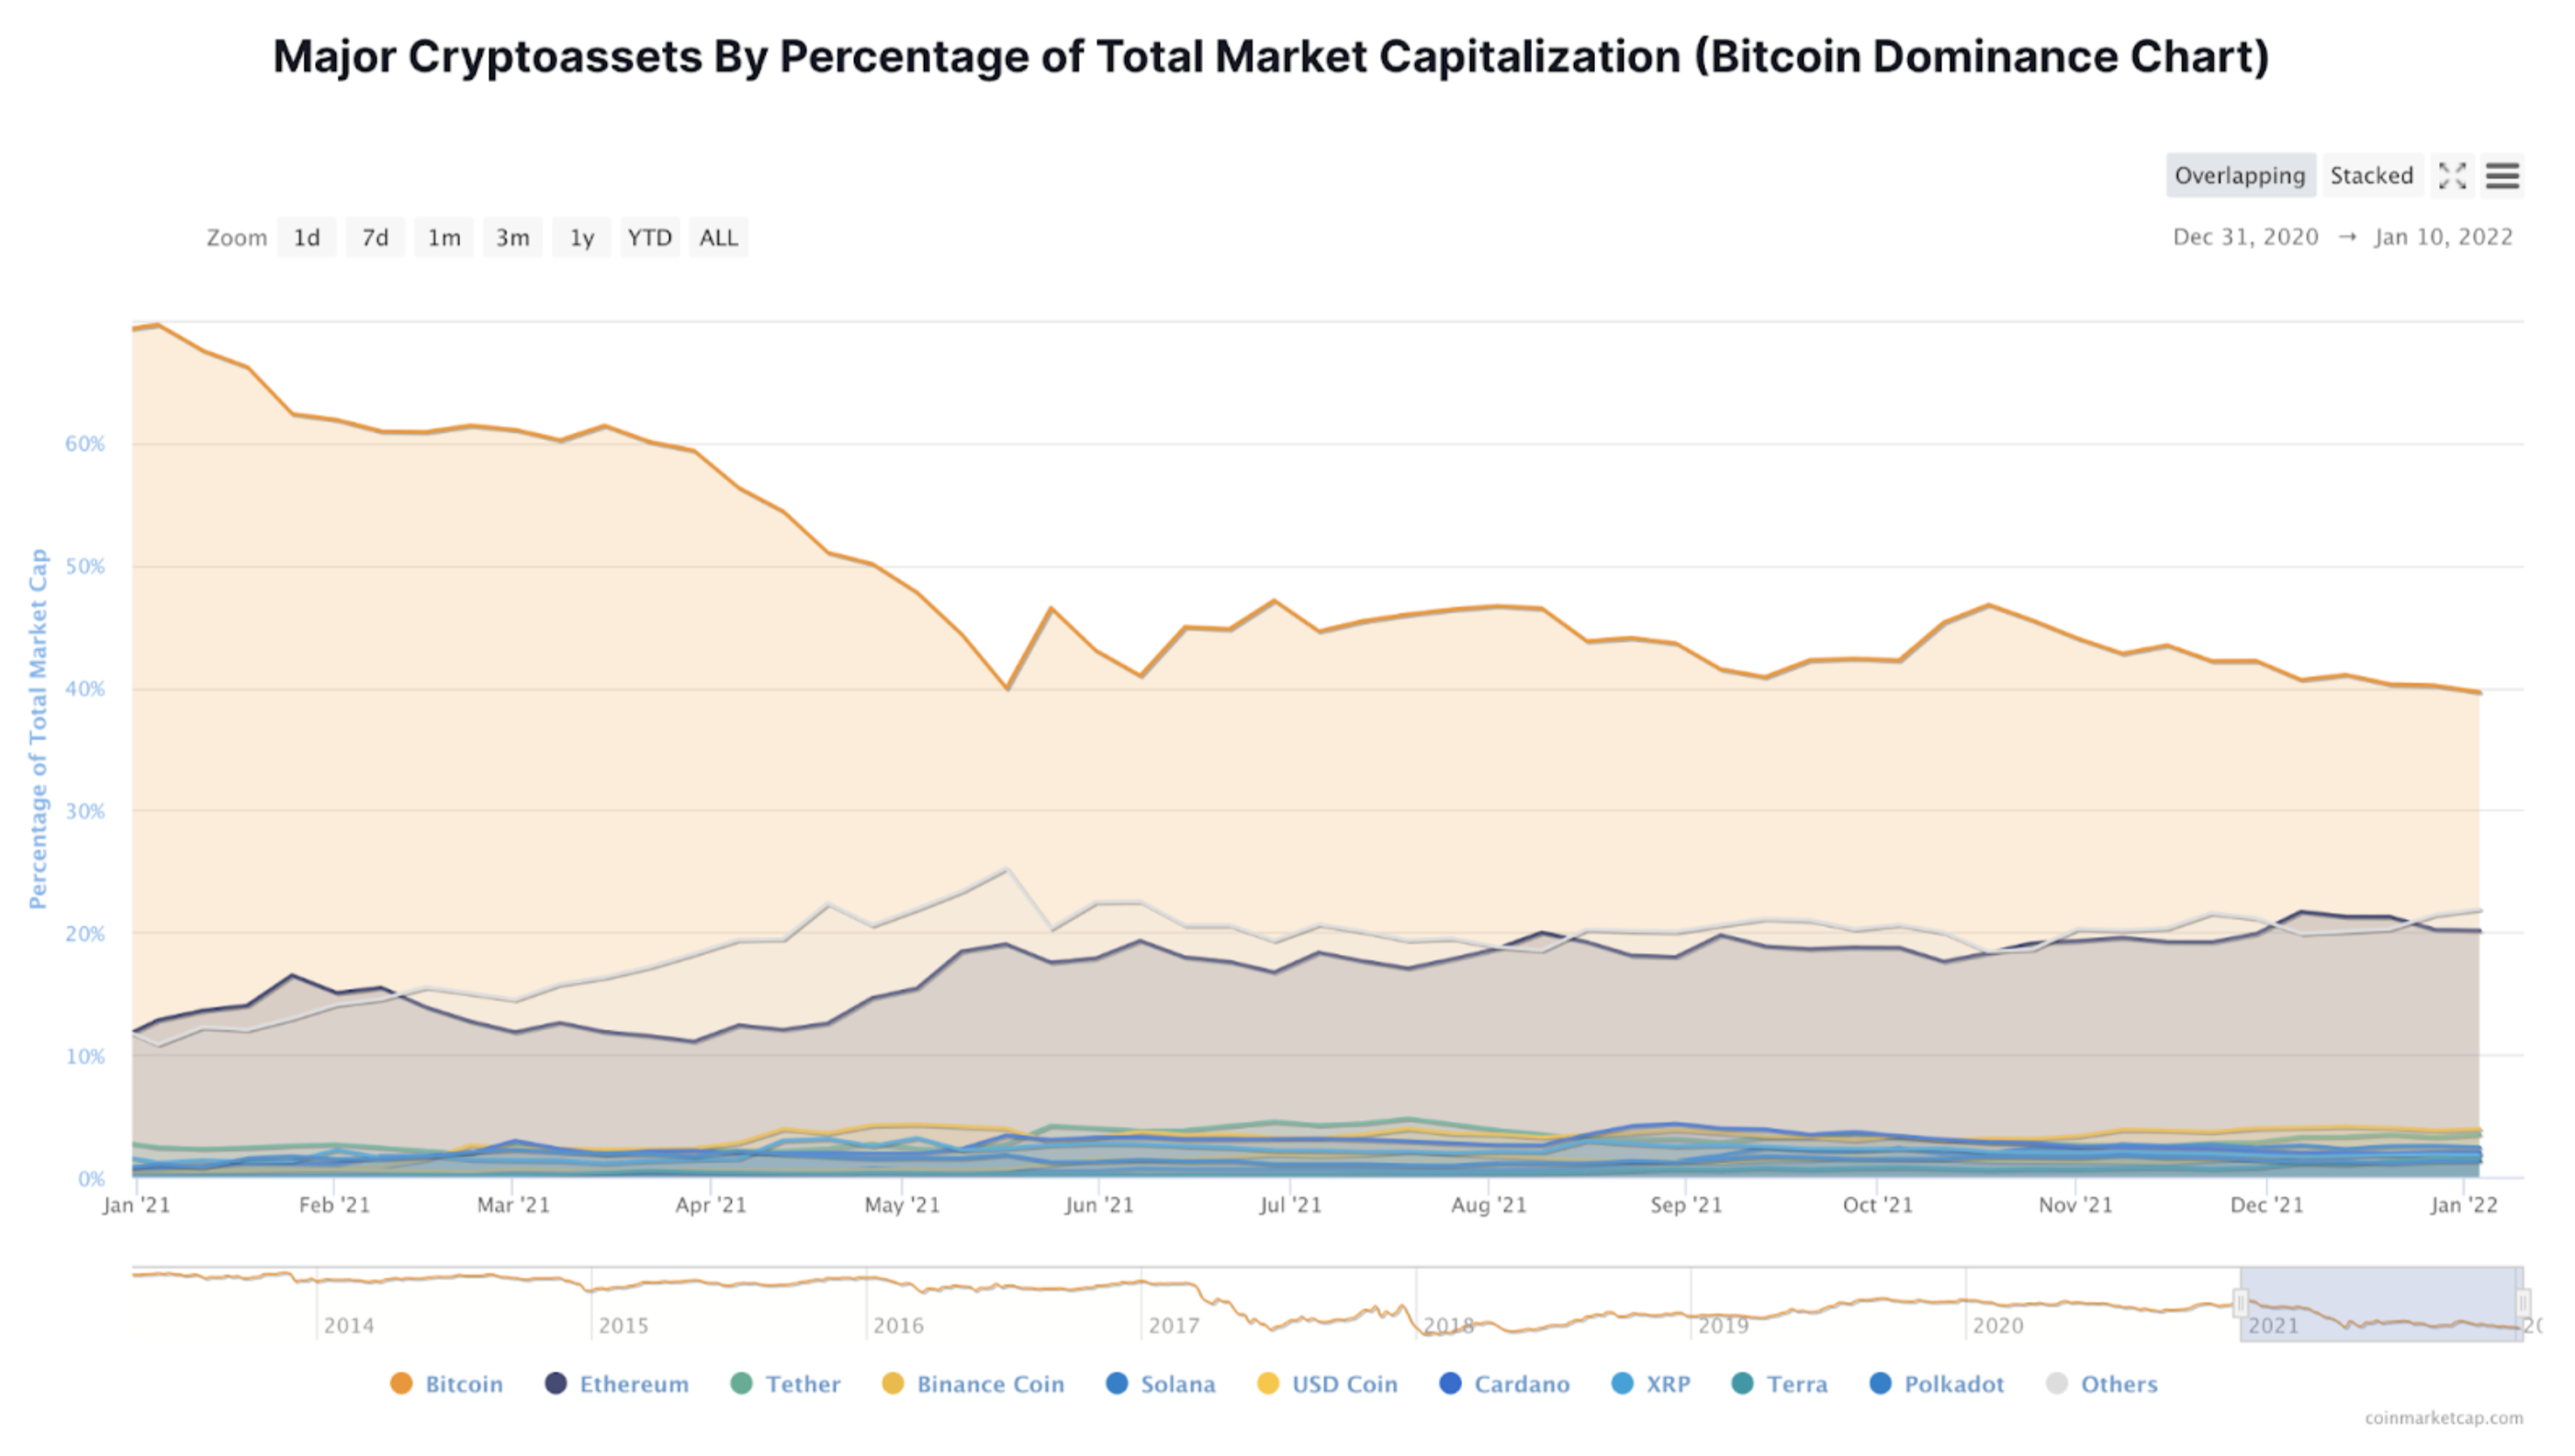
Source: CoinMarketCap
As we can see in the above screenshot, the market dominance of Bitcoin had a steady downtrend in 2021. Contrarily, Ethereum and a few other altcoins saw a clear uptrend.
13 Years of Revolutionizing Global Finance
Bitcoin also celebrated its 13th Birthday this week. It is needless to discuss the impact and disruption this cryptocurrency has created in the finance sector and our daily lives. The world's largest crypto has made millionaires and paved the way for thousands of cryptocurrencies. The recent innovations in the blockchain ecosystem with NFTs and Metaverse wouldn't have been possible if not for Bitcoin.
As of today, Bitcoin's blockchain size is close to 400 GB, and a total of 717,800 blocks have been mined. With close to 18.92 million BTC in circulation, more than 90% of all the BTC tokens to ever exist are produced. Although it is forecasted that 2140 could be the year where we mine the last Bitcoin, the deflationary vibe is already prevalent, increasing Bitcoin's value in coming years.
Fundamentals Surrounding the Markets
The crypto sell-off began Jan 5, right after the Fed released minutes from its December committee meeting. The document stated that the US central bank could tighten monetary policy much quicker than previously expected, and might consider 3 interest rate hikes in 2022.
This new play of events affects cryptos and other volatile assets as more traditional investors may choose investments that come with fewer risks.

Source: TradingEconomics
The stock market is usually very sensitive to any hint of an increase in interest rates, and this time is no different. The S&P 500 has plunged nearly 2% in 2022, with numerous of its stocks dropping over 10% of their value.

S&P 500 Chart On The 2h and 4h Time Frames Source: TradingView
In addition to the Fed bringing bearish news to the crypto markets, another important factor that may have contributed to BTC’s price drop was none other than the political unrest in Kazakhstan.
Kazakhstan, which became the world's second-largest center for Bitcoin mining, saw a nationwide power outage, which immediately caused the hash rate of Bitcoin to drop by a staggering 12%.
Bitcoin Technical Analysis
As they always say, “When in doubt, zoom out.” The below weekly price chart of Bitcoin could be the right example of this analogy. Despite the recent downturn with a streak of Red candlesticks, BTC has delivered notable profits for investors in 2021. As we can see in the below weekly Bitcoin price chart, BTC/USDT has made two decent higher highs with a healthy consolidation.
Currently, the price is at the strong support level, and this could be a good point for buyers to take back control. The support and resistance levels are as follows:
Support 1 - $42,200
Support 2 - $31,600
Resistance 1 - $49,500
Resistance 2 - $59,200

Bitcoin Price Chart On The Weekly Time Frame | Source: BTC/USDT
On the daily price chart, Bitcoin's price has reached a significant support level at around $39,500. We can see the price forming a Doji candlestick, indicating clear indecision between the buyers and sellers. Both 20 & 50-period moving averages could be seen sloping down, which indicates the possibility of price plummeting to the downside. Indicators are showing that $40,000 could be a psychological level that tests the market sentiment, which dip below might spur a further downturn.

Bitcoin Price Chart On The Daily Time Frame | Source: BTC/USDT
If the sellers manage to bring the price below the $40,000 mark, the bear run could intensify, and the price might plummet to the $31,600 support zone. Contrarily, if the buyers manage to take support from the current support zone, the BTC/UST pair could rise to the current 20-day EMA ($49,900). This could be the only way for the bulls to push prices further and resume the overall bull run.
2022 Price Analysis
Crypto experts and trade analysts are highly positive about Bitcoin's price action in 2022. They seem to certainly believe that the current sluggish run of Bitcoin's price will have almost no impact on its price as the year progresses. One of the most credible and notable forecasts includes the opinion of Mike McGlone, a reputed Bloomberg Intelligence analyst. He forecasted Bitcoin's price to reach $100,000 this year in a recent analysis.
Another reputed Goldman Sachs analyst Zach Pandl gave a similar Bitcoin price prediction. In a recent research note, he mentioned that Bitcoin could certainly take a part of Gold’s market share in 2022. Despite the current downtrend, BTC could achieve the $100,000 market by the end of this year, according to Goldman Sachs predictions.
Irrespective of these long-term predictions, the current subdued trading in BTC could continue for a while, extending the consolidation. It is currently uncertain whether BTC will continue to go lower or take a quick turn to the north. According to technical analysis, there is some market indecision due to the appearance of Doji candlestick on the daily timeframe.
Did you know that KuCoin offers premium TradingView charts to all of its clients? With this, you can step up your Bitcoin technical analysis and easily identify various crypto chart patterns.
Sign up on KuCoin, and start trading today!
Follow us on Twitter >>> https://twitter.com/kucoincom
Join us on Telegram >>> https://t.me/Kucoin_Exchange
Download KuCoin App >>> https://www.kucoin.com/download
Also Subscribe to our Youtube Channel >>>Listen to 60s Podcast