What are Bollinger Bands, and How to Apply Them in Crypto Trading?

Learn everything about applying Bollinger Bands to crypto trading and grasp the essentials of this dynamic tool to optimize your trading strategies for maximum gains.
More and more people are looking for ways to invest in a place with some immunity to the prevailing inflation levels, especially in today’s volatile times. Apart from gold, USD, and other safe-haven financial assets, cryptocurrencies are also gaining traders' attention as an escape from inflation. The problem is cryptocurrency trading comes with a high level of risk because of the high volatility associated with the market.
But what if there was a way to gain insight into the current market's volatility? That could make the volatility of a given cryptocurrency measurable and help determine entry and exit levels.
Cryptocurrency traders use different kinds of technical analysis indicators to predict future price momentum. One of the most widely used and popular technical indicators is Bollinger Bands. It processes market volatility, defines possible entry/exit levels, analyzes the market trend, and gives information about the cryptocurrency's overbought and oversold conditions.
Let's take a deep dive into what Bollinger Bands can do. How is it calculated? How to read it? And how does it apply to different trading strategies in cryptocurrency trading to spot trading opportunities?
What Are Bollinger Bands?
An American asset manager and technical analyst, John Bollinger, designed this technical indicator and named it after himself in 1980. The Bollinger Bands are abbreviated as BBs in the financial markets. They are mainly used to measure a cryptocurrency price's present and past volatility or any other financial asset, including stocks, commodities, and forex.
The BBs indicator consists of three bands that work as volatility indicators and quantify a given cryptocurrency's relative high and low price concerning the preceding trades. The standard deviations measure the volatility, which tends to move with the volatility. The gap between the bands increases or widens when the price rises, and the gap between the bands usually contracts when the price falls.
BBs have three bands or lines, including the upper, middle, and lower bands. The middle one represents a simple moving average, while the upper and lower bands represent the two standard deviations from the middle band. In short, BBs give an insight into the volatility of a cryptocurrency relative to a periodic norm.
How to Apply Bollinger Bands Indicator on KuCoin Charts
Here's how you can add the Bollinger Bands to your KuCoin exchange chart.
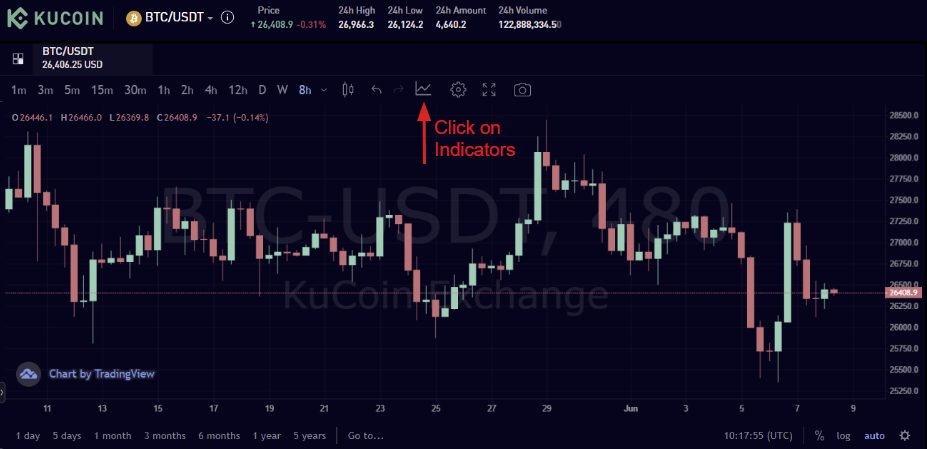
Step 1: Select the Indicator
Choose the indicator from the options shown in the KuCoin trading chart above.
Step 2: Search for Bollinger Bands
Type Bollinger Bands in the search bar, and the Bollinger Bands indicator will appear on a list of indicators in the search list.
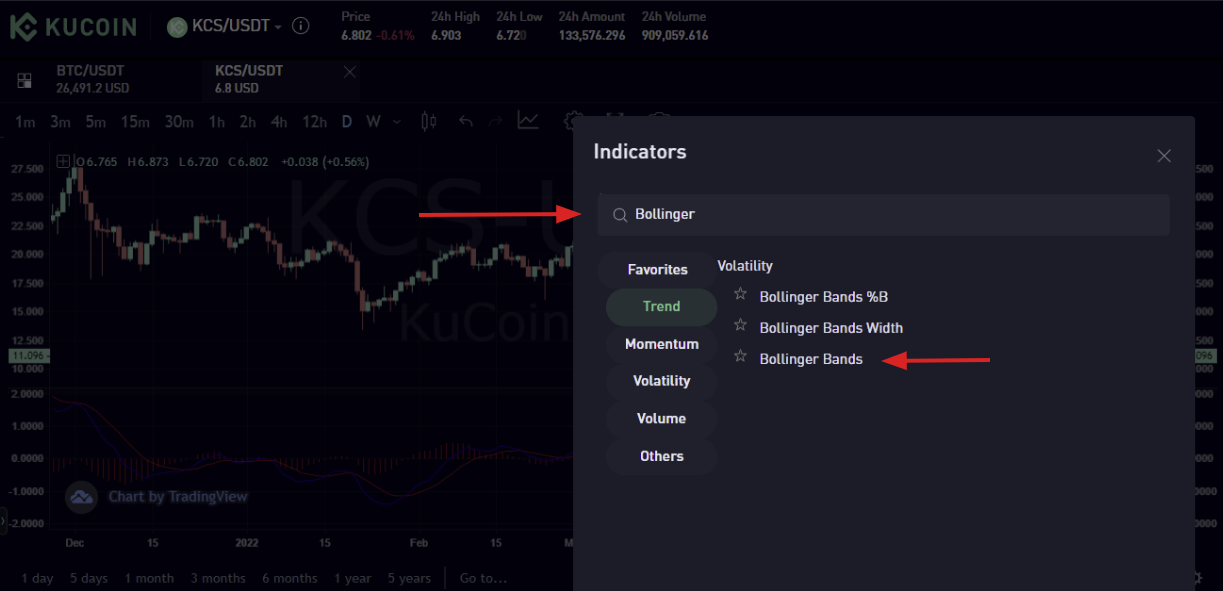
Step 3: Select Bollinger Bands From Technical Indicators
Choose the Bollinger Bands from the list of technical indicators, and it will be automatically applied to your KuCoin chart.

The Structure of Bollinger Bands
-
The middle band comprises a simple moving average of N periods.
-
The upper band gives the value by adding K times the standard deviation of a cryptocurrency's price to the middle line's value.
-
The lower band gives the value by subtracting K times the standard deviation of the price of a cryptocurrency from the middle line.
In most cases, the parameters of Bollinger Bands are set as N = 20 and k = 2 by default, but they can be customized according to a trader's needs. Another intriguing feature of Bollinger Bands is that you can change the value of "k" and replace the SMA with the EMA. When a cryptocurrency trader applies this formula to a KuCoin price chart, the price resembles an envelope or a channel. It's depicted in the graph below:
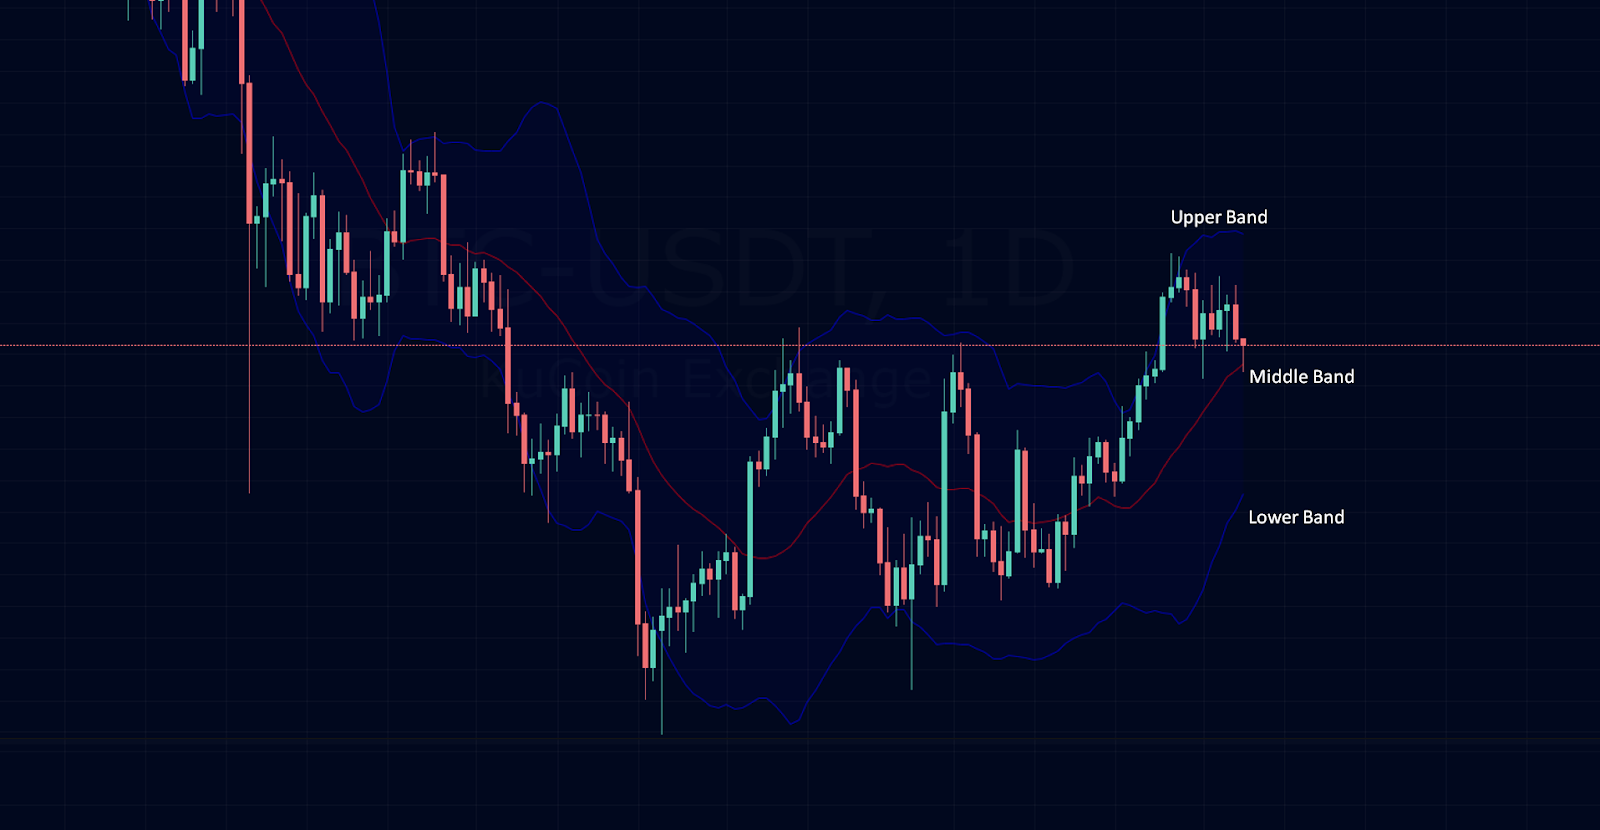
Upper, Lower, and Middle Lines
The upper line represents the positive standard deviation from the SMA, while the lower line represents the negative SMA. They are visible in blue and are referred to as the upper and lower bands. The middle line, shown in red above, is an SMA based on the last 20 periods. The closing price of the previous 20 periods or candles is added and then divided by 20, as the name implies.
-
The bands become wider when there is more volatility around the SMA. When there is less volatility, they contract or draw closer and become smaller.
-
Another thing that Bollinger Bands can reveal is the overbought and oversold areas. When a price makes new highs or lows within the bands, and the next new high or low level goes outside the band, there is a chance of a trend reversal.
-
Surging cryptocurrency prices can sometimes outperform the upper band while declining prices can outperform the lower band. It does not imply that the trend will now reverse. However, the band can also indicate a trend continuation pattern in such a case.
-
The market is said to be moving in a range when the price of a given cryptocurrency continues to fluctuate between the upper and lower bands. A range-bound market can be used to define price support and resistance levels.
-
A cryptocurrency is in a trend if its price consistently moves above the middle line of the Bollinger Band and hits the upper band for an extended period.
-
A breakout is expected when both the upper and lower bands come close to each other for an extended period of time.
It is essential to have experience recognizing the difference between continuation and reversal signals using the Bollinger Bands. This experience can only be achieved through practice and reading the indicators.
Settings of Bollinger Bands
A trader's trading style mostly determines the settings of Bollinger Bands. The recommended settings for various types of traders are as follows:
Day Traders: The short-term traders are recommended to set their SMA in Bollinger Bands at 10 periods and bands at 1.5 SD.
Swing Traders: Mid-term traders should set the SMA to 20 periods and the SD to 2. These are also the default Bollinger Band parameters in the majority of platforms.
Position Traders: Long-term traders are advised to use a 50 SMA as the middle band, and for the upper and lower bands, the standard deviation settings are recommended as 2.5.
How to Use Bollinger Bands in Crypto Trading
As previously stated, Bollinger Bands can be used to find various trading signals. Now, it's time to look at how it's used in cryptocurrency trading to find profitable trading opportunities. Traders can adopt the following ways to take advantage of the Bollinger Bands, namely
Bollinger Bounce Strategy
The Bollinger Bounce is the most basic and straightforward trading strategy involving the Bollinger Bands. The simple rules to follow when implementing this strategy are as follows:
-
Execute a buying trade whenever the price touches the lower band, and execute a short-trade or selling trade whenever the price touches the upper band.
-
Place a trailing stop at the 20 MA and change it whenever the moving average changes.
-
When the price returns to the 20-MA, exit the market and your trade immediately.
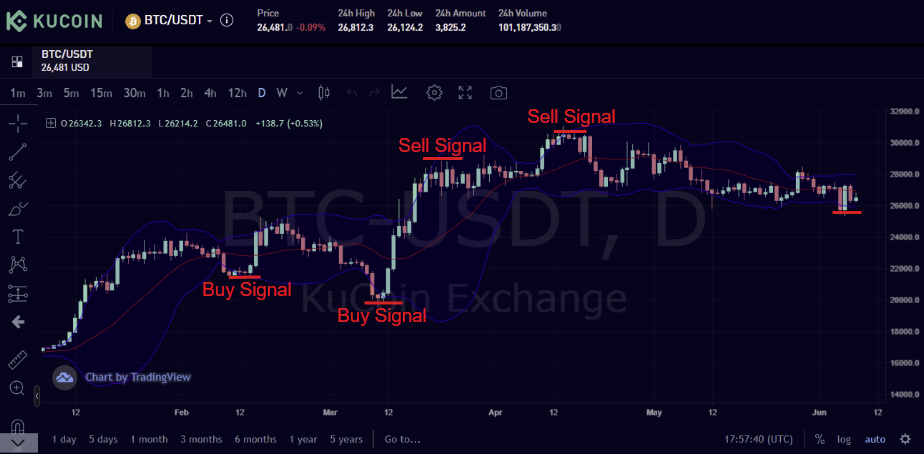
Let’s take a look at the KuCoin BTC/USDT trading chart, for example. When BTC crosses the upper Bollinger Band, crypto investors begin shorting it.
Similarly, the bulls enter the market when the BTC price breaks through the lower Bollinger Band.
These were the simple Bollinger Band bounce rules to follow to make a profitable trade. However, it is more complex per se. This strategy will work only if the market is moving sideways or within a range, in other words, when the bands are almost flat for a long time.
Whereas, if the market is trendy or the bands are changing the curve positively or negatively, this strategy might cost you a lot of money. So, avoid using Bollinger Bounce in a trending market and use it only in a trendless market.
Bollinger Band Squeeze: Identifying New Trends
As previously stated, Bollinger Bands can also be used to identify the beginning of a new trend. So, this strategy is about identifying new trend levels.

The rules are also straightforward:
-
Look for a prolonged low volatility period in the market. The low volatility can be defined by narrowing bands.
-
Now, wait for the period or a candle to close outside the bands. The breakout can be above or below the bands.
-
The breakout will happen when the bands start to expand.
-
It is the beginning of a trend. After identifying this trend, open a trade toward the breakout.
-
If the price breaks through the upper band, you can open a buy trade.
-
You can open a sell trade if the price breaks through the lower band.
Finding W-Bottoms & M-Tops
Asides from trading squeeze and bounce, traders can also use Bollinger Bands to make trades after finding W-bottoms and M-tops in the price chart of a cryptocurrency. They are very easy to find and trade.
W-Bottoms
Finding a W-bottom pattern in a price chart can be tricky. Therefore, the simple rule is to look out for double bottoms. The first declining candlestick should be closed outside the Bollinger Bands, while the second low should always happen inside the Bollinger Bands.

Bitcoin has formed a W-bottom or a double-bottom pattern, as seen on the daily chart above. A reversal is likely to happen when cryptocurrency prices bounce back from the second low level. Traders can now open a long or buy position in the market.
M-Tops
When cryptocurrency prices reach high levels, M-top is a signal that suggests Traders lookout for a pattern to find out if the first high is outside the Bollinger Band while the second high is inside the Bollinger Band.

Bitcoin has formed an M-top or a double-top pattern, as seen on the daily chart. Once you find this pattern, you can open a short position or a sell trade. It is because, after that, there will most likely be a possible trend reversal, as shown in the chart below.
Bottom Line
Bollinger Bands are a great technical indicator tool for identifying excellent trading opportunities. The important thing is to keep the bands' interpretation in mind, as they are made in accordance with market trends. It can vary between a trendy market and a range-bound market. They should not be used solely to identify overbought or oversold zones.
For confirmation of those signals, it is recommended that their readings be combined with those of other indicators. They work well with the RSI , Stochastic RSI, or MACD indicators, and are widely used to determine entry and exit points. Experienced traders never rely on a single indicator and only execute trades after multiple indicators have confirmed them.
Disclaimer: The information on this page may come from third parties and does not necessarily reflect KuCoin’s views. It is provided for general reference only and should not be interpreted as financial or investment advice.
Virtual asset investments may involve risk. Please carefully assess the product risks and your own risk tolerance. For more information, please refer to our Terms of Use and Risk Disclosure.