A Comprehensive Guide to the Flag Patterns and How to Trade Bull and Bear Flags
Learn the ins and outs of how to use bull and bear flags to predict trends in the crypto market.
The best cryptocurrency traders in the world employ a variety of trading strategies. In the study of technical analysis, the flag pattern is one of the prominent ones. Therefore, flag patterns and their counterpart, the bear and bull flags, are among the most popular patterns. These patterns enable traders to participate in trending markets, comprehend price movements, and establish low-risk entries.
Trading flag patterns in cryptocurrency trading allows you to easily spot trend continuations and catch huge price swings. Typically, it is difficult to enter a fast-moving trade within a market, but flag chart patterns make it easier to time the market.
Whether you're a seasoned trader or just starting your journey in the financial markets, this guide will equip you with the knowledge and confidence to identify and capitalize on these highly sought-after patterns.
What Is a Flag Pattern?
The flag pattern is a price pattern that consists of two parallel trend lines. It is a continuation pattern used to predict the future movement of prices. The high and low prices create these patterns during the duration of the flag. The slope of these trendlines can be either up or down, but they must be parallel to each other.
The price will often move sideways before it breaks out in one direction. The breakout will, however, depend on what type of flag pattern it is — bullish or bearish.
Because the pattern causes price action, crypto traders immediately rush to buy or sell their holdings to profit when the flagpole appears.
The flag pattern generates a small ascending or descending trend channel that resembles an upward or downward-sloping parallelogram, giving the chart pattern the appearance of a flag. That is why it is named this way.
As soon as the descending or an ascending channel violates, it signals the start of the next leg of the trend continuation, and the price moves forward.
Bullish flag patterns are possible, as are bearish flag patterns:
-
Bullish flag pattern = Bull Flag
-
Bearish flag pattern = Bear Flag
Price action breakouts can occur in either direction, but the chances of a trend continuation remain high with a flag pattern. This means the bull flag breakout can trigger a bullish trend continuation, and a bearish flat breakout point can drive a solid downtrend.
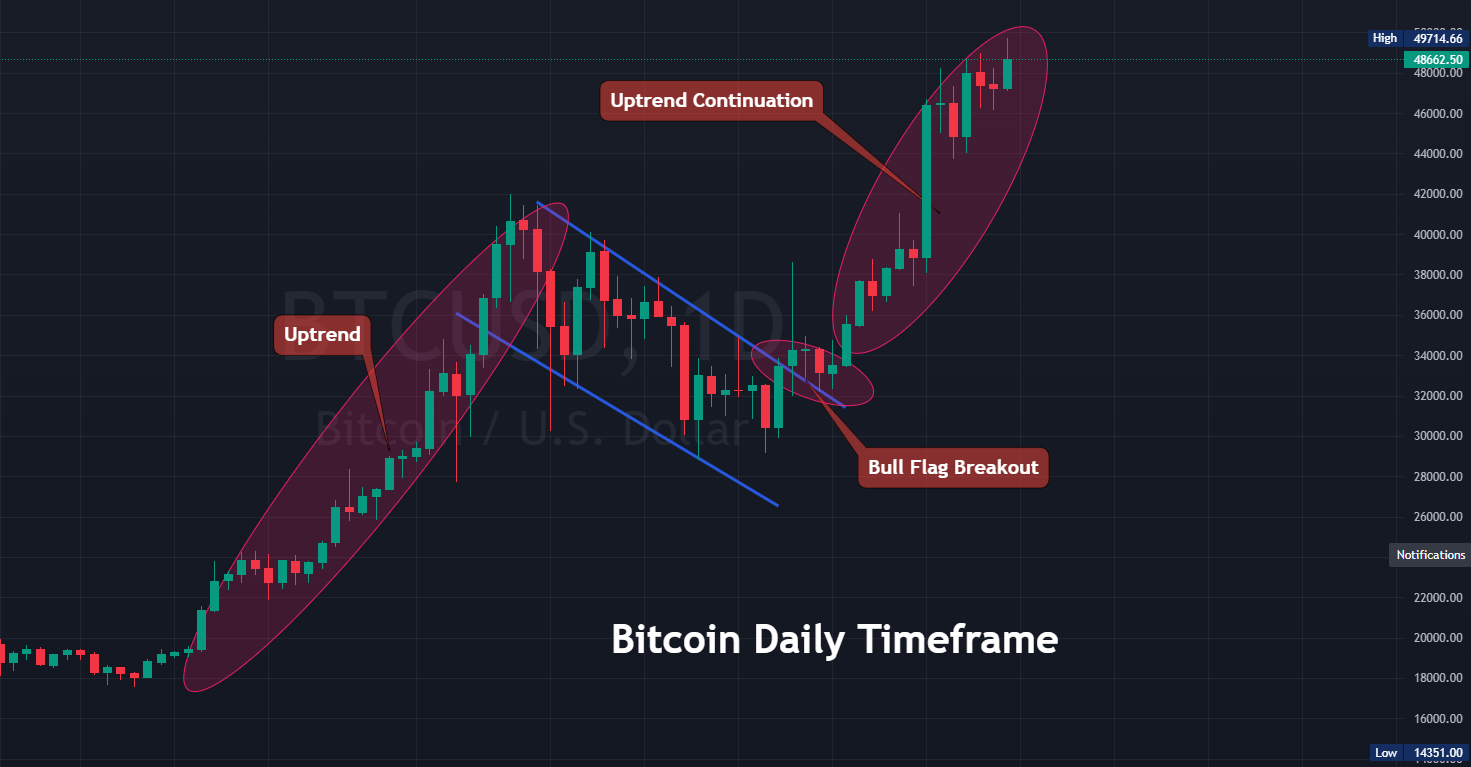
Bull Flag Pattern
The bull flag chart pattern is a bullish continuation pattern, and it's formed by two parallel lines, with the second line being significantly shorter than the first. The bull flag pattern usually occurs in a market trending upwards and has been moving sideways for an extended period.
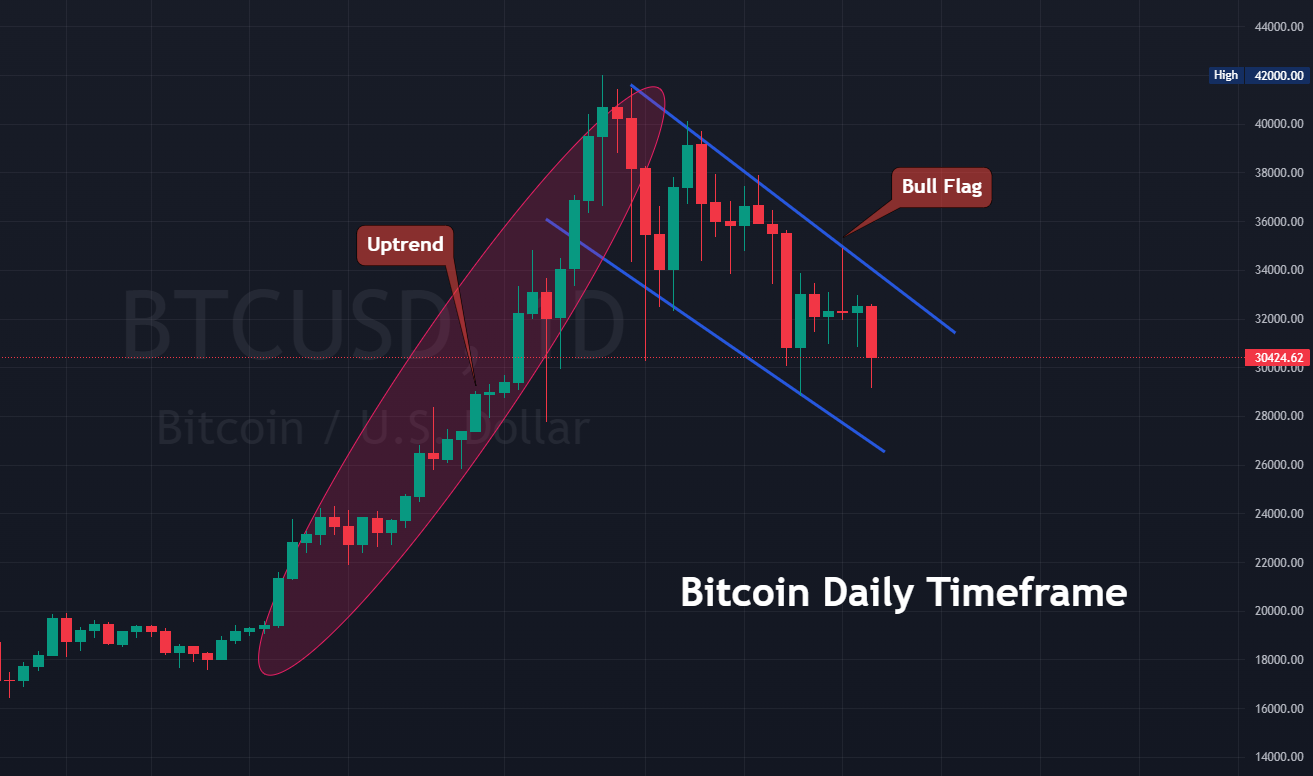
To trade this pattern, you must wait for the price to break out of the flag formation and then set your stop loss below the low wick of that breakout.
How to Trade Bull Flag Patterns
Traders can use a bull flag chart pattern to trade a trending market. For instance, if the cryptocurrency price is trending upward, a buy-stop order can be placed above the high of the flag.
If it is moving downwards and the flag violates on the lower side, a sell-stop order can be placed below the low of the flag. So, in both cases, you can capture trades. Typically, bull flags have a high tendency to break out on the higher side.
Conversely, if you are still determining what kind of trend your market is in, use other technical indicators such as the moving average, RSI, stochastic RSI, or MACD to help determine which direction to take.
Buy-Stop Order
Looking at the chart below, the buy-stop order was placed above the descending trendline of a bull flag pattern on the daily timeframe. The entry price was set at $37,788 to ensure that two candles outside the bull flag pattern were closed to validate the breakout.

At the same time, the stop-loss was set below the flag pattern's immediate low of $26,740. It is critical to place stop-losses to protect our portfolio if the market reverses on some fundamentals.
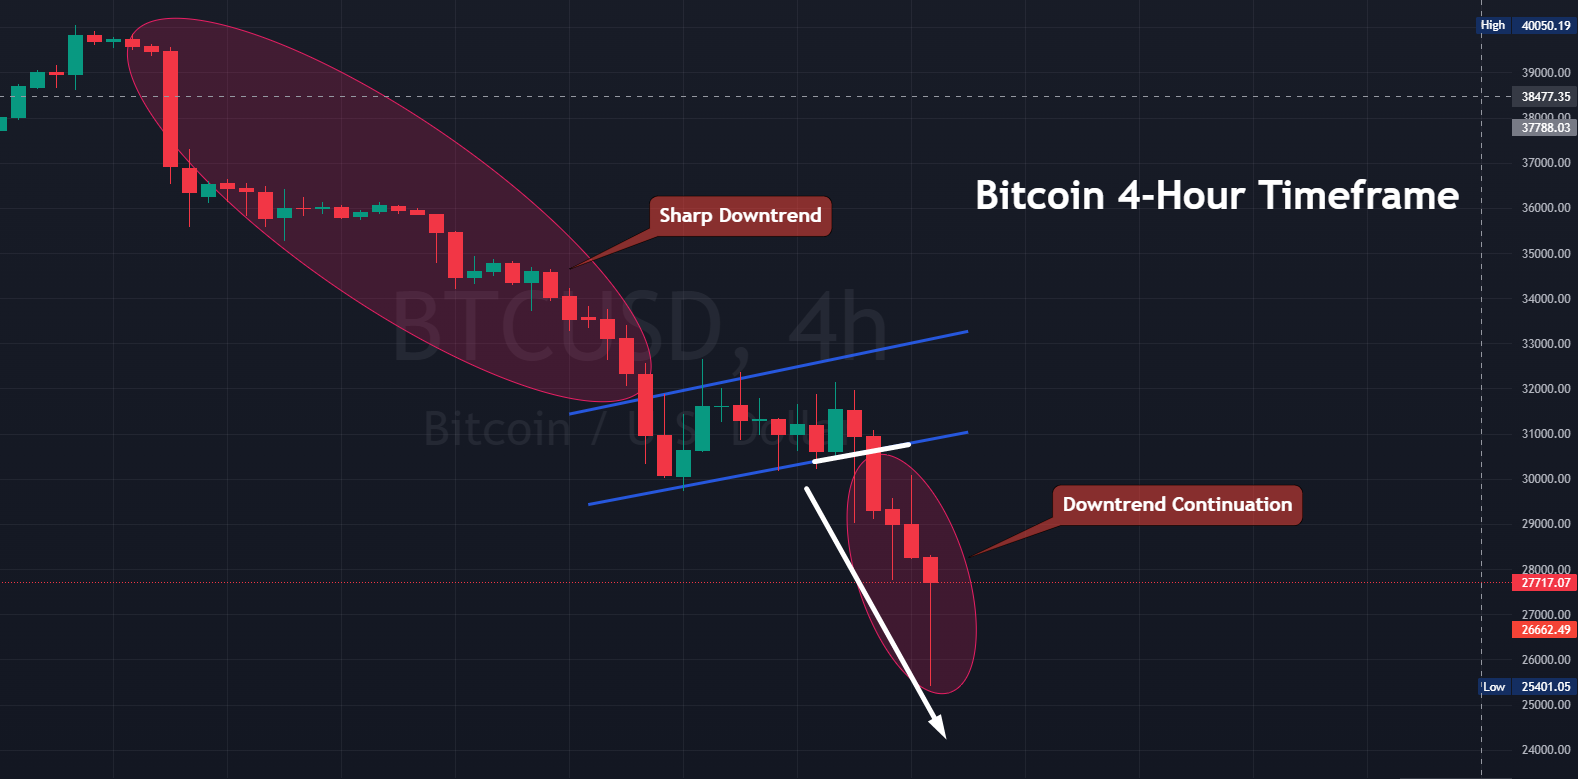
Bear Flag Pattern
The bear flag pattern is a continuation pattern found in all timeframes. It occurs after an uptrend and signals a slowdown or decline in the market.
In cryptocurrency trading, the bear flag is a bearish pattern formed from two declines separated by a brief period of consolidation. The flagpole is generated by a virtually vertical panic decline in the price caused by sellers catching bulls off guard, followed by a bounce with parallel upper and lower trend lines forming the flag. The sell-off ends with profit-taking, forming a narrow trading range with higher highs and higher lows.
Typically, the price will rise to test the resistance level before dropping and closing near its opening price. The bear flag pattern can be seen in all time frames, but it is more common to see it in lower time frames as opposed to higher ones because of how quickly it develops.
How to Trade Bear Flag Patterns
A bear flag can be used to trade a trending market, especially when the market is in a downtrend. If the cryptocurrency price is in a downtrend, a sell-stop order can be placed below the low of the flag.
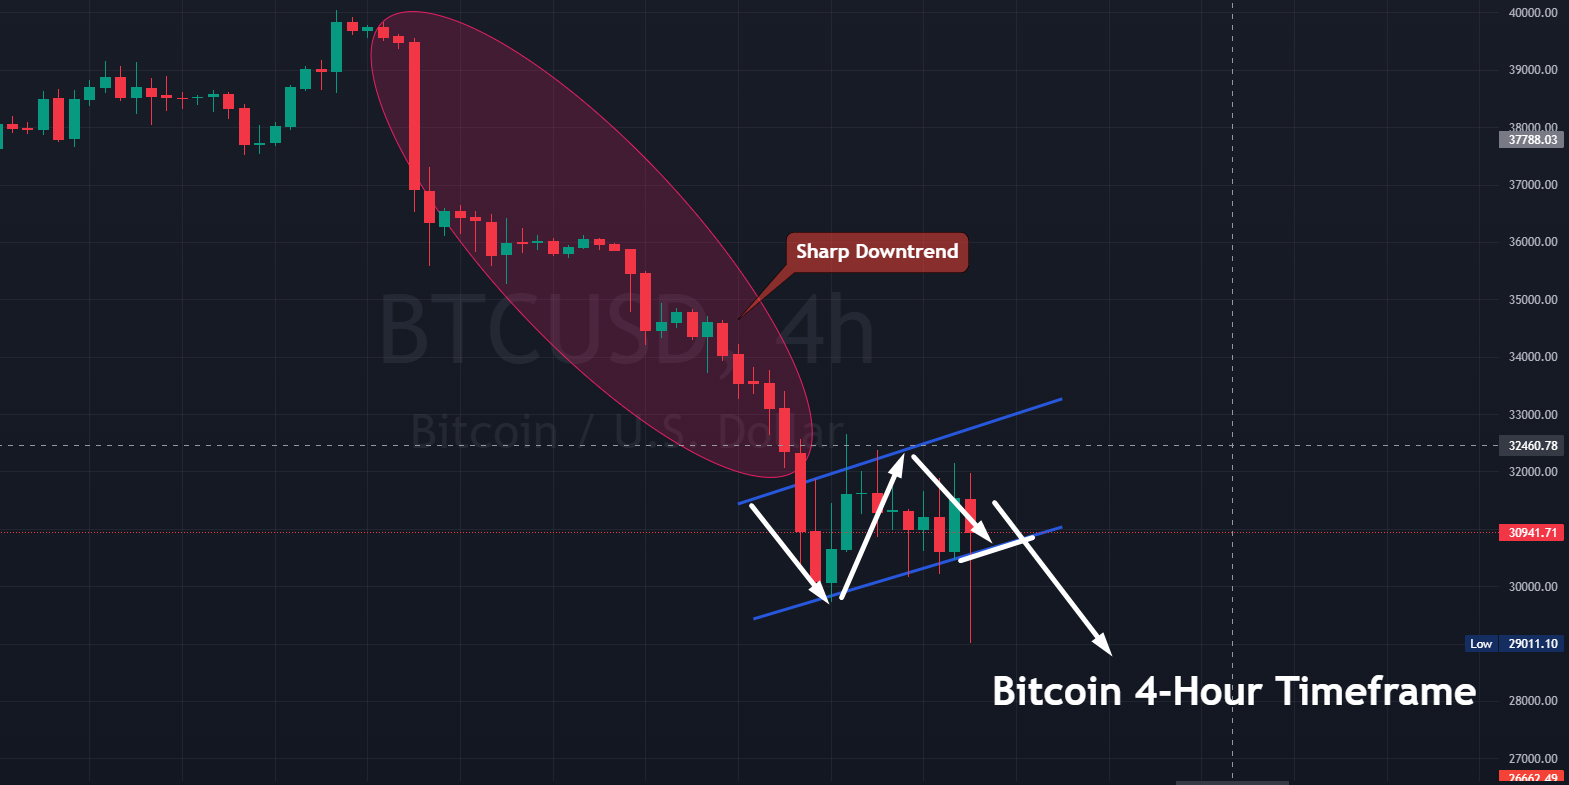
If it rises and breaches the flag on the higher side, a buy-stop order can be placed above the flag's high. So you can capture trades in both cases.
Bear flags have a high propensity to break out on the downside.
As previously stated, it is always best to combine such patterns with leading and lagging indicators such as moving averages, RSI, or MACD to determine the strength of a trend.
Sell-Stop Order
The sell-stop order was placed below the ascending trendline of a bear flag pattern. The entry price was set at $29,441 to ensure that two candles outside the bear flag pattern were closed to validate the breakout.
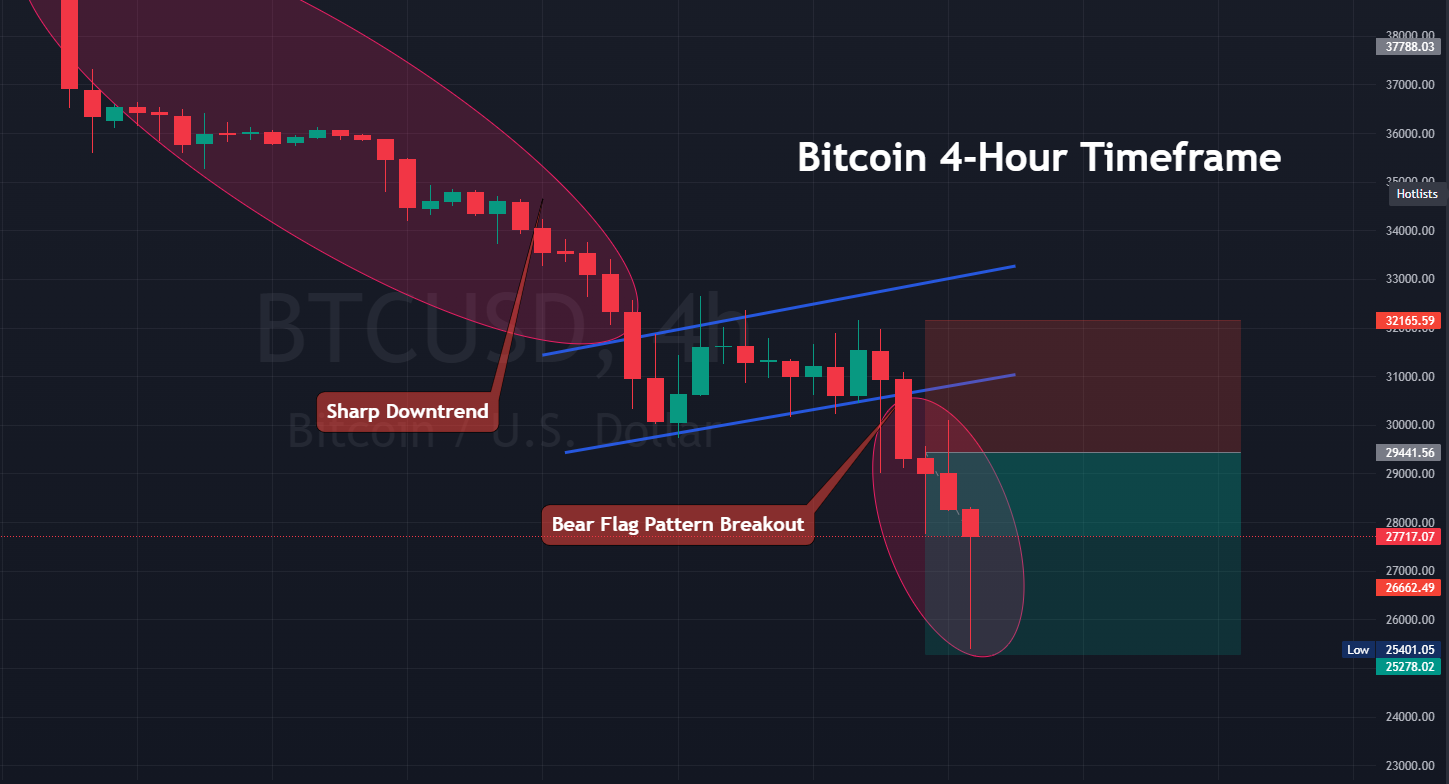
The pending order also contains the stop loss, which was set above the flag pattern's immediate high of $32,165. It is critical to place stop losses to protect your portfolio if the market reverses on some fundamentals.
How Long Until the Price Gets To My Stop Order?
The time it takes for a stop order to be executed is difficult to predict because it depends on market volatility and a flag pattern breakout. If you trade smaller timeframes such as M15, M30, or H1, your order will likely be filled within a day.
However, if you trade on higher timeframes, such as H4, D1, or W1, you can get filled in days or weeks. This is also dependent on market volatility.
Nevertheless, adhere to risk management practices and place stop losses on all pending orders. For more information, see KuCoin's Risk Management strategies.
Are Bull and Bear Flag Patterns Reliable?
Flag patterns and pennants are generally reliable. The bull and bear flag has been proven to be effective and is used by successful traders all over the world.
Of course, trading is fraught with risk. Nonetheless, these indicators and chart patterns provide traders with some assurance.
However, they all have advantages and disadvantages, and bull or bear flags are no exception.
-
A bull or a bear flag breakout offers a well-defined entry price from which to enter a long trade.
-
It establishes a clear location for the stop-loss order, providing the necessary support for proper trade management.
-
This pattern typically provides asymmetrical risk-to-reward scenarios where the potential profit (target) exceeds the risk. In other words, it's a pattern that is the foundation for an effective risk management system.
-
The bull and bear flag is simple to apply in a trending market.
The steps for identifying the patterns are straightforward.
Bottom Line
The flag pattern is a common technical analysis tool that allows us to predict and prepare for a bullish or bearish entry ahead of time. A bull flag pattern indicates a strong uptrend and a buying opportunity upon the bullish breakout of a descending channel.
On the other hand, the bear flag pattern indicates a strong downtrend; thus, a bearish breakout of the bear flag can be an excellent opportunity to short the digital asset.
Crypto trading is risky because the market can react abnormally to the latest fundamentals. As a result, adhering to risk management strategies is critical to protect yourself from unusual market movements.
Disclaimer: The information on this page may come from third parties and does not necessarily reflect KuCoin’s views. It is provided for general reference only and should not be interpreted as financial or investment advice.
Virtual asset investments may involve risk. Please carefully assess the product risks and your own risk tolerance. For more information, please refer to our Terms of Use and Risk Disclosure.