What Is Williams %R Indicator, and How to Use It in Crypto Trading

Williams %R gauges trend strength & potential reversals. Learn how to use the Williams %R to determine the strength of a trend, potential trend reversals, and entry/exit points.
Numerous technical indicators are available in cryptocurrency trading and can be used to forecast prices. Once you have mastered the fundamental indicators, you can progress to more advanced ones in order to increase the accuracy of predicting future price movements.
In this article, we will look at the Williams %R indicator as a complementary indicator to use for increased trade success; everything you need to know about the indicator, and various trading strategies based on the %R indicator.
What Is Williams %R?
One of the less popular but more sensitive versions of the stochastic indicator and a member of the momentum indicator family is the Williams %R Indicator. It is also called the "%R" or "William Percentage Range." The most common application of this indicator is to detect potential price corrections or trend reversals. It is also well-known for identifying overbought and oversold levels in cryptocurrency prices.
Asides from measuring the overbought and oversold zones, Williams %R is also used to determine the market's possible profitable entry and exit levels. Williams %R is a negative version of the Stochastic Indicator. Its value falls between 0 and -100, where 0 is the highest value, and -100 is the lowest value.
How to Apply Williams %R Indicator on KuCoin Charts
Here's how you can add the Williams %R to the chart on the KuCoin Trading page.
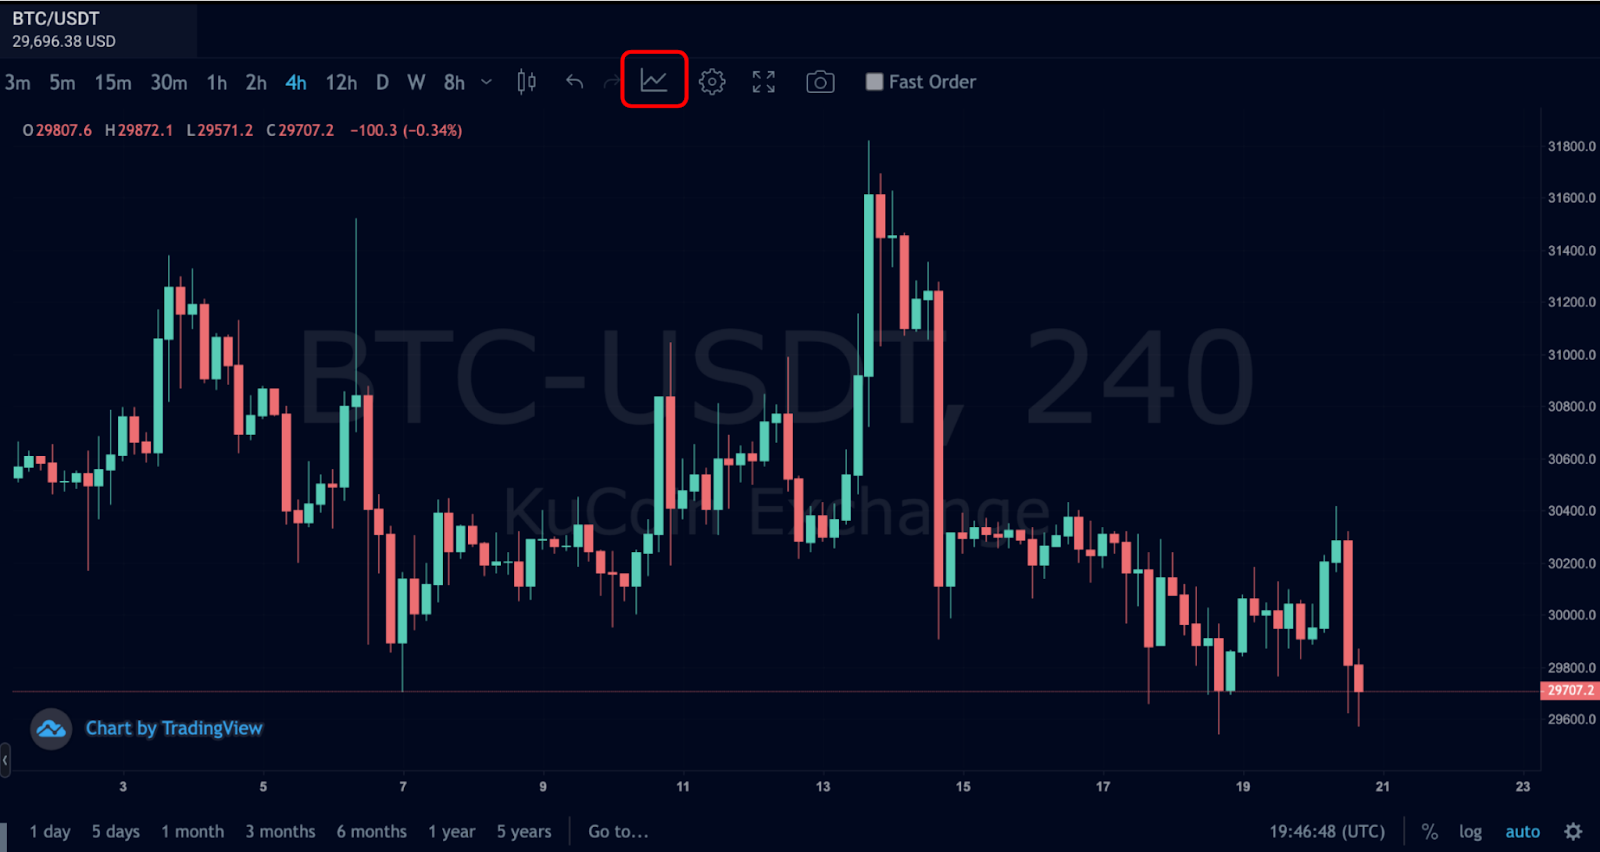
Step 1: Select Your Indicator
Click the indicator button on the KuCoin trading terminal.
Step 2: Search for the Williams %R Indicator
Type Williams %R in the search bar, and the Williams %R indicator will appear on a list of indicators in the search list.
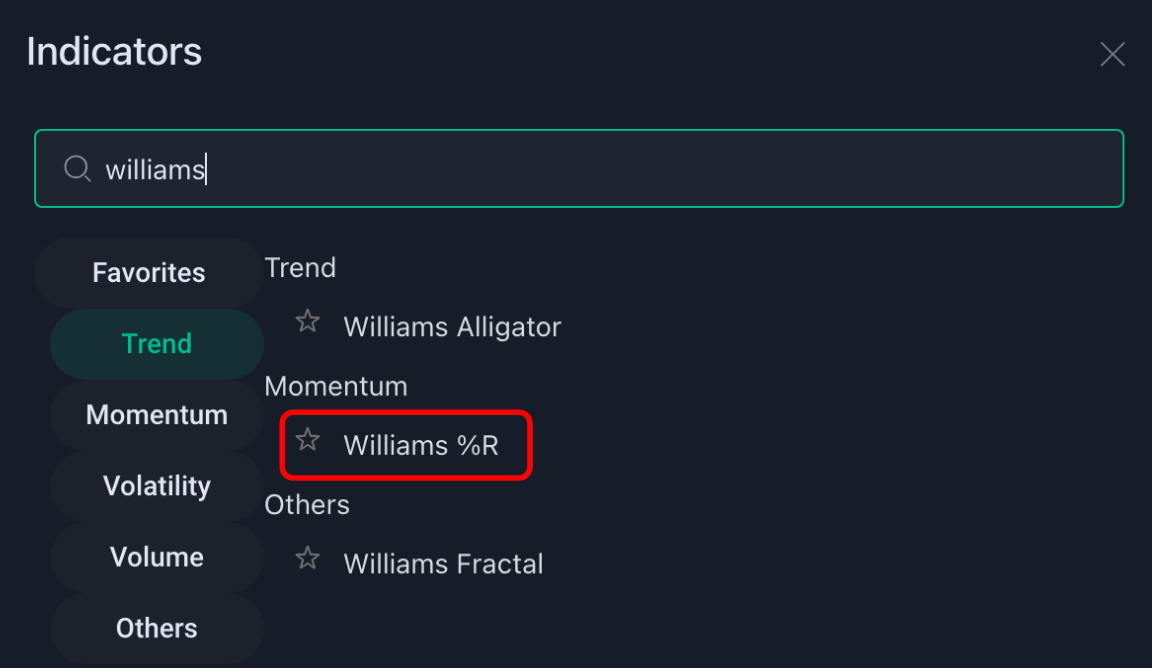
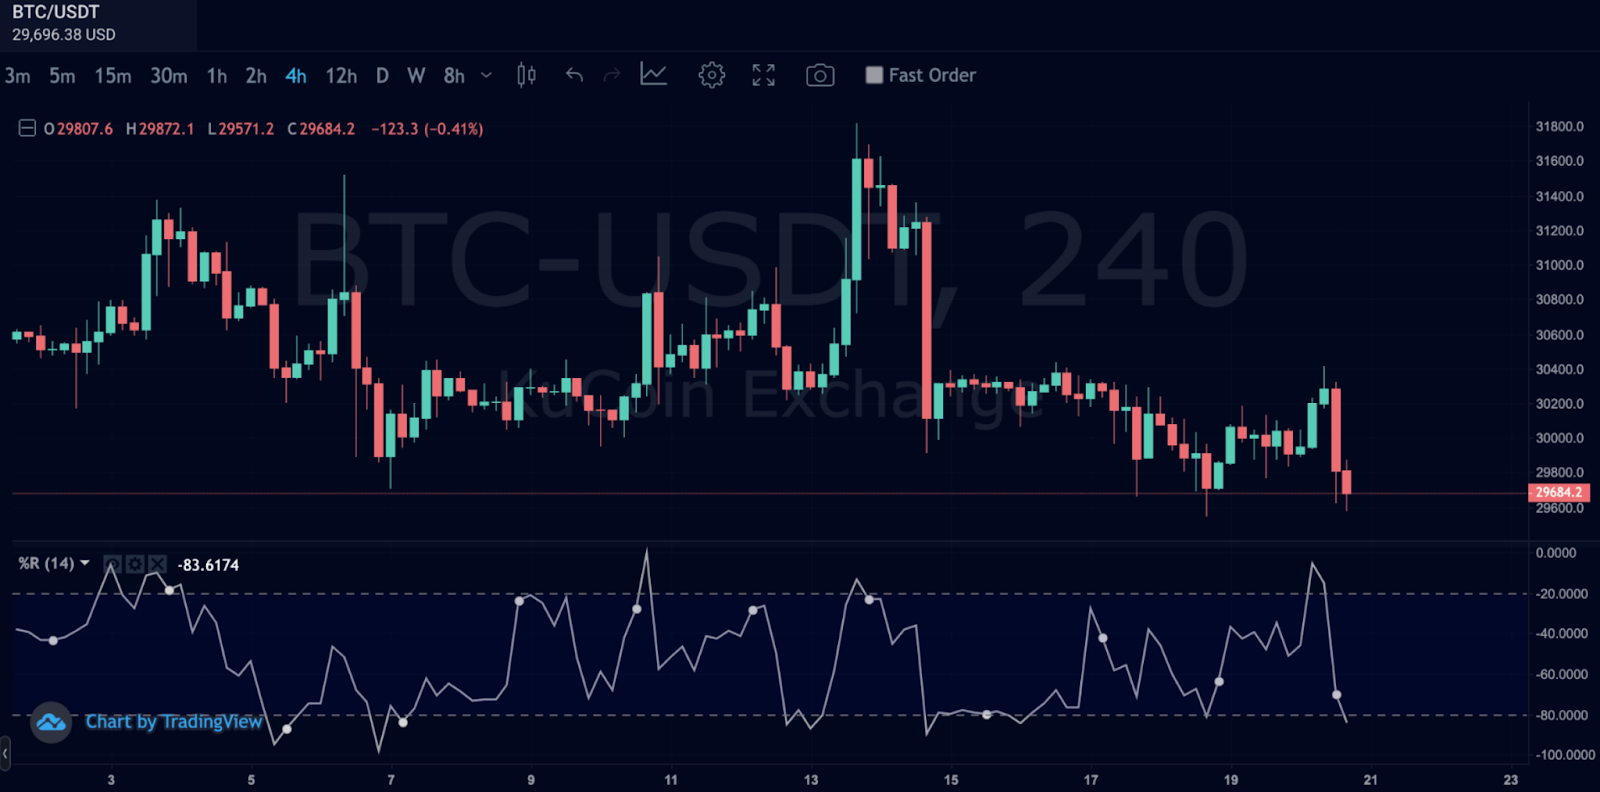
Step 3: Select Williams %R From the Technical Indicators
Choose the Williams %R from the list of technical indicators, which will automatically apply to your KuCoin chart.
How Is Williams %R Calculated?
As previously stated, the structure of this technical indicator is similar to that of the stochastic indicator. As a result, their formulas are also interchangeable. Let's take a closer look.
WR = [ { Highest High – Current Close } / { Highest High – Lowest Low } ] x ( -100 )
Where:
-
WR = Williams %R
-
The prices are taken for the last 14 periods
The Williams %R is calculated based on price, typically over the last 14 periods. The value of %R is range-bound as it comes within a range of 0 and -100. As a result, a Williams %R is an effective tool for determining overbought and oversold zones in price momentum.
Reading a range-bound signal is comparatively easier than reading other technical indicators.
For instance, if the value of the %R indicator comes to -30, it will mean that the cryptocurrency is moving in the top 30% of the range. Similarly, if the %R gives a value of -80, the cryptocurrency moves in the bottom 20% range.
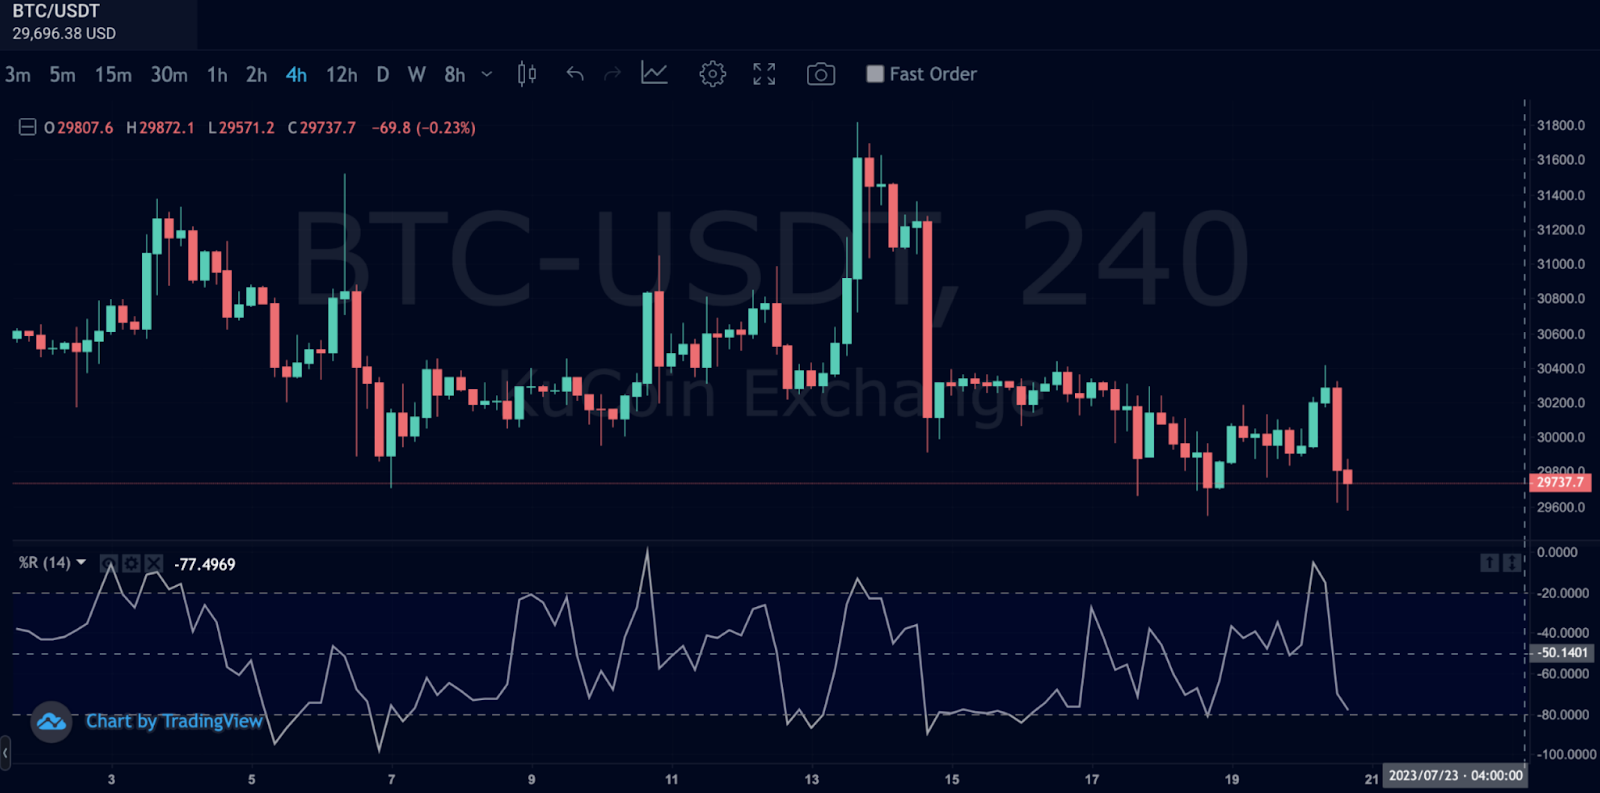
How to Read and Interpret Williams %R
In the range of 0 and -100, -50 is considered the midpoint of the William %R. If the value crosses the -50 range from below or moves above the midpoint, there is a bullish trend in the market. Conversely, if the value of %R crosses the midpoint from above or falls below -50, the cryptocurrency is moving in a bearish trend.
Williams %R Overbought and Oversold Signals
Williams % R is a potent tool for detecting overbought or oversold reading and profiting from reversals. Let's have a look at the overbought and oversold scenarios.
Williams %R Overbought Markets
The reading of the %R above the -20 level typically means the cryptocurrency is overbought. It implies that the crypto can reach its highs anytime soon, a signal for a possible price correction.
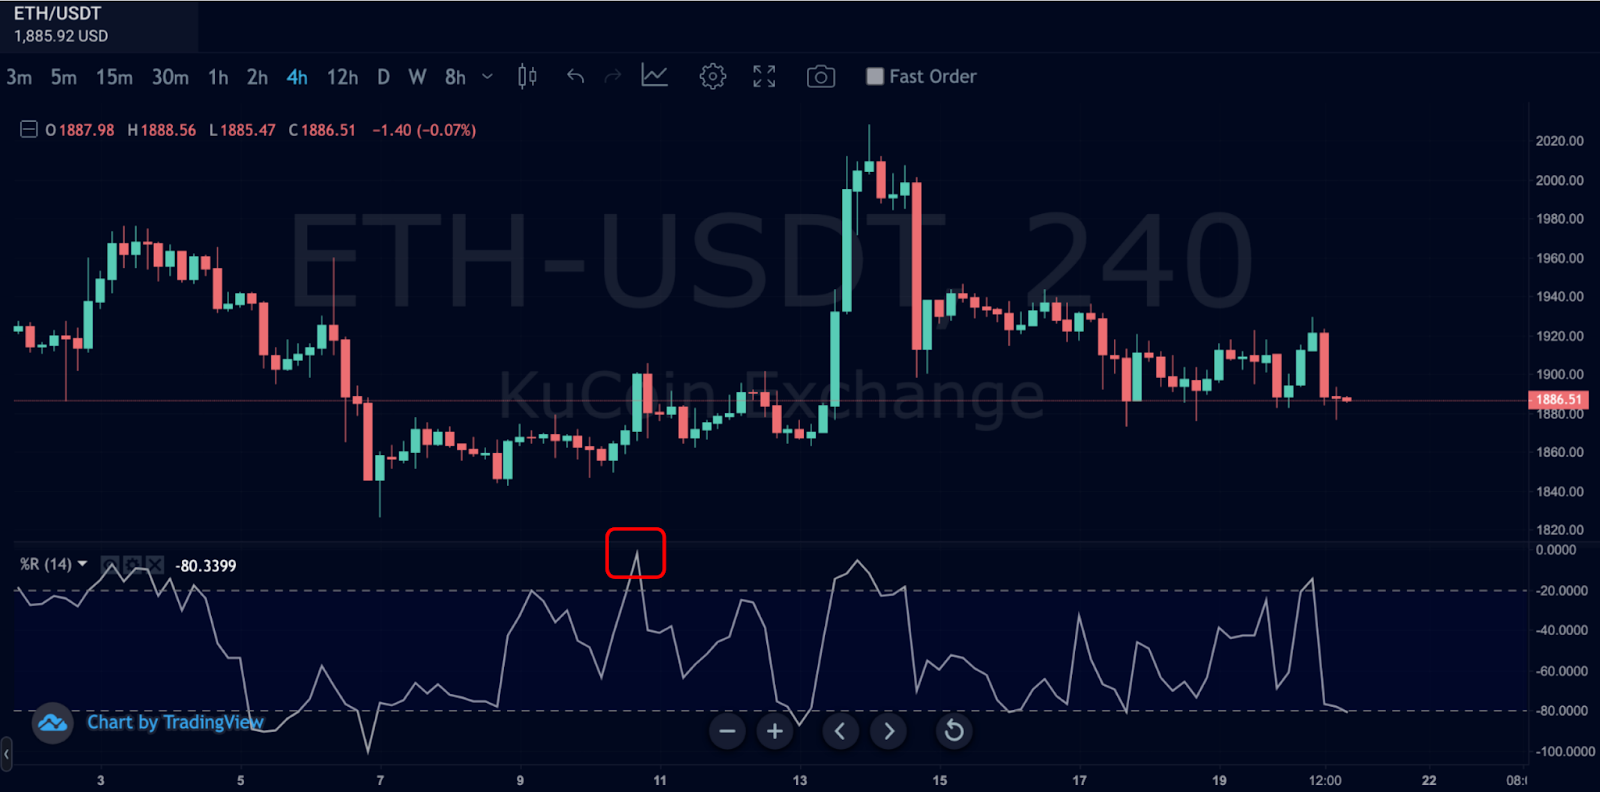
If the %R value moves above the -20 level but fails to stay above it in the next move, it may indicate that the bullish trend is fading. As seen on the ETH/USDT KuCoin Chart, the Williams %R indicator enters the overbought zone (above -20), causing sellers to enter the market.
Williams %R Oversold Markets
If the value of %R falls below the -80 level, the cryptocurrency is typically reflected as an oversold market. This suggests that the market is experiencing rash selling behavior, which might trigger a bullish reversal anytime soon.
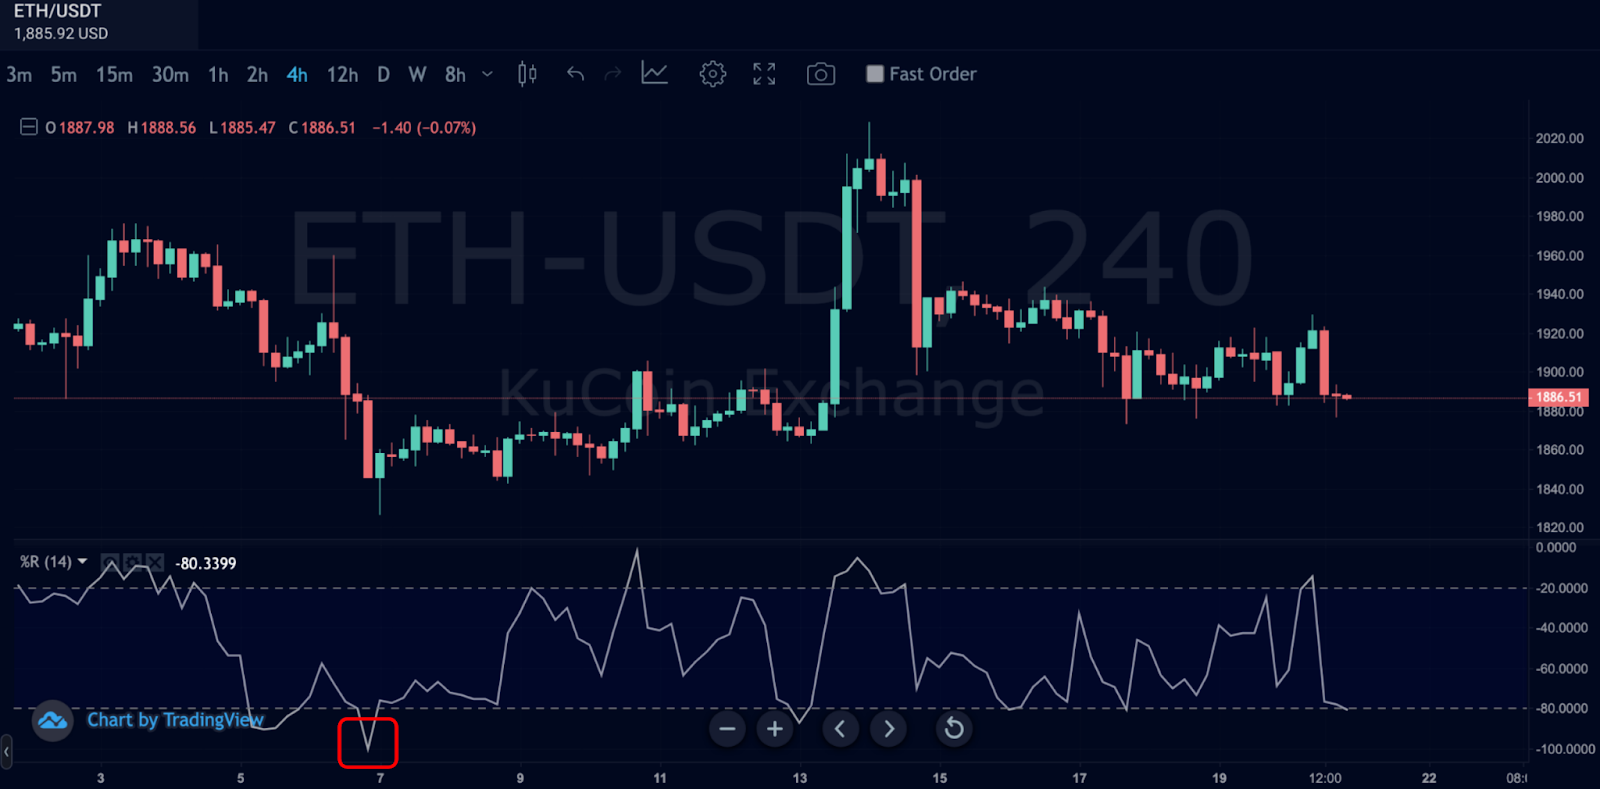
If the value of %R moves below -80 and fails to stay below this level in the next move, it indicates a potential upward trend, as the bearish trend is likely to fade soon. As seen on the ETH/USDT KuCoin Chart, the Williams %R indicator enters the oversold zone (under -80), causing buyers to enter the market.
Trading Williams %R Divergences
Williams %R is also used to find divergences in the market; it happens when the %R value moves against the price momentum.
Williams %R Bearish Divergence
If the price shows a bullish signal, but the Williams %R indicates falling, it is known as a "bearish divergence." This type of divergence can generate a good signal for a price correction. We can open a short position and earn significant amounts through this signal.

The ETH/USDT price chart above shows that the price is rising while the Williams percent range is falling. This is known as bearish divergence, and it indicates a sell trade.
Williams %R Bullish Divergence
If the price of a cryptocurrency moves downward, making lower lows, and William %R moves upward, making higher lows, a bullish divergence occurs. This can be a good signal to open a buying position in the market. The bullish divergence created by %R means that the price of a cryptocurrency might reverse soon.
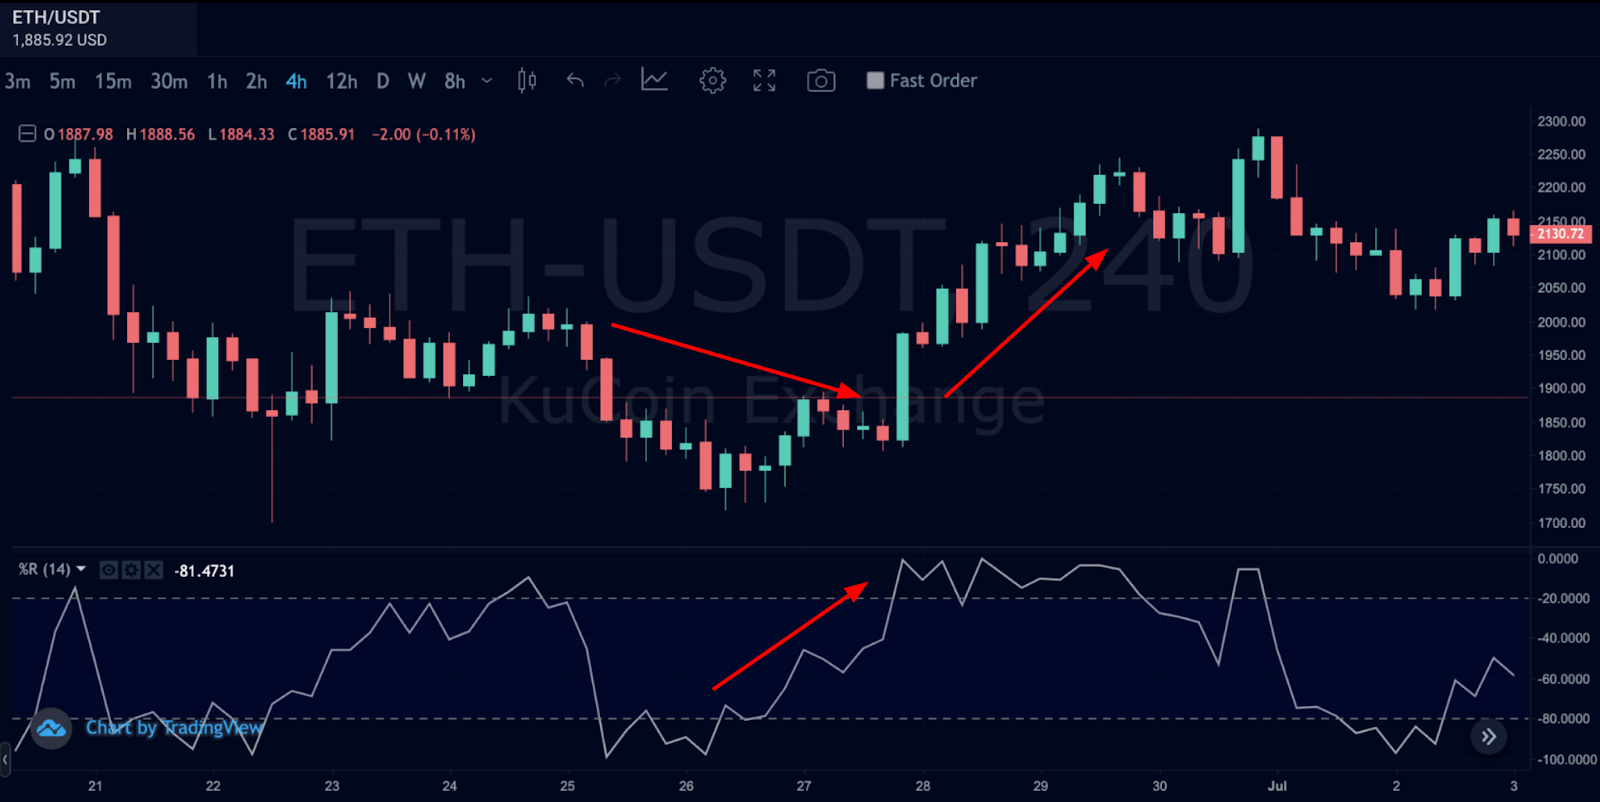
The price is falling on the ETH/USDT price chart above, while the Williams percentage range is rising. This is known as bullish divergence, and it indicates a buy trade.
How to Use William %R in Cryptocurrency Trading?
Cryptocurrency traders use the William %R to generate profitable trading signals. The highly volatile nature of the cryptocurrency market demands some strategy before blindly entering the market. Therefore, it is easier for a trader to use technical indicators to have an overview of what is happening in the cryptocurrency market before opening his trading position.
Let us consider some trading strategies involving %R.
Williams %R + 20 Days Moving Average
One simple and easy trading strategy involving William %R is to combine it with a moving average. This method effectively provides good signals in a highly volatile market. It is simple to implement but extremely effective.
This strategy combines the 20-day moving average with the Williams %R to predict the entry and exit points. If the price closes below the moving average while the Williams %R indicator also moves below the 50 line or mid-point, it indicates that a short trade is possible.
Similarly, suppose the price is moving above the moving average line, and the Williams %R indicator is also moving above the midpoint or 50 level. In that case, it indicates that a long position in the market is possible. Let us take a look at an example:
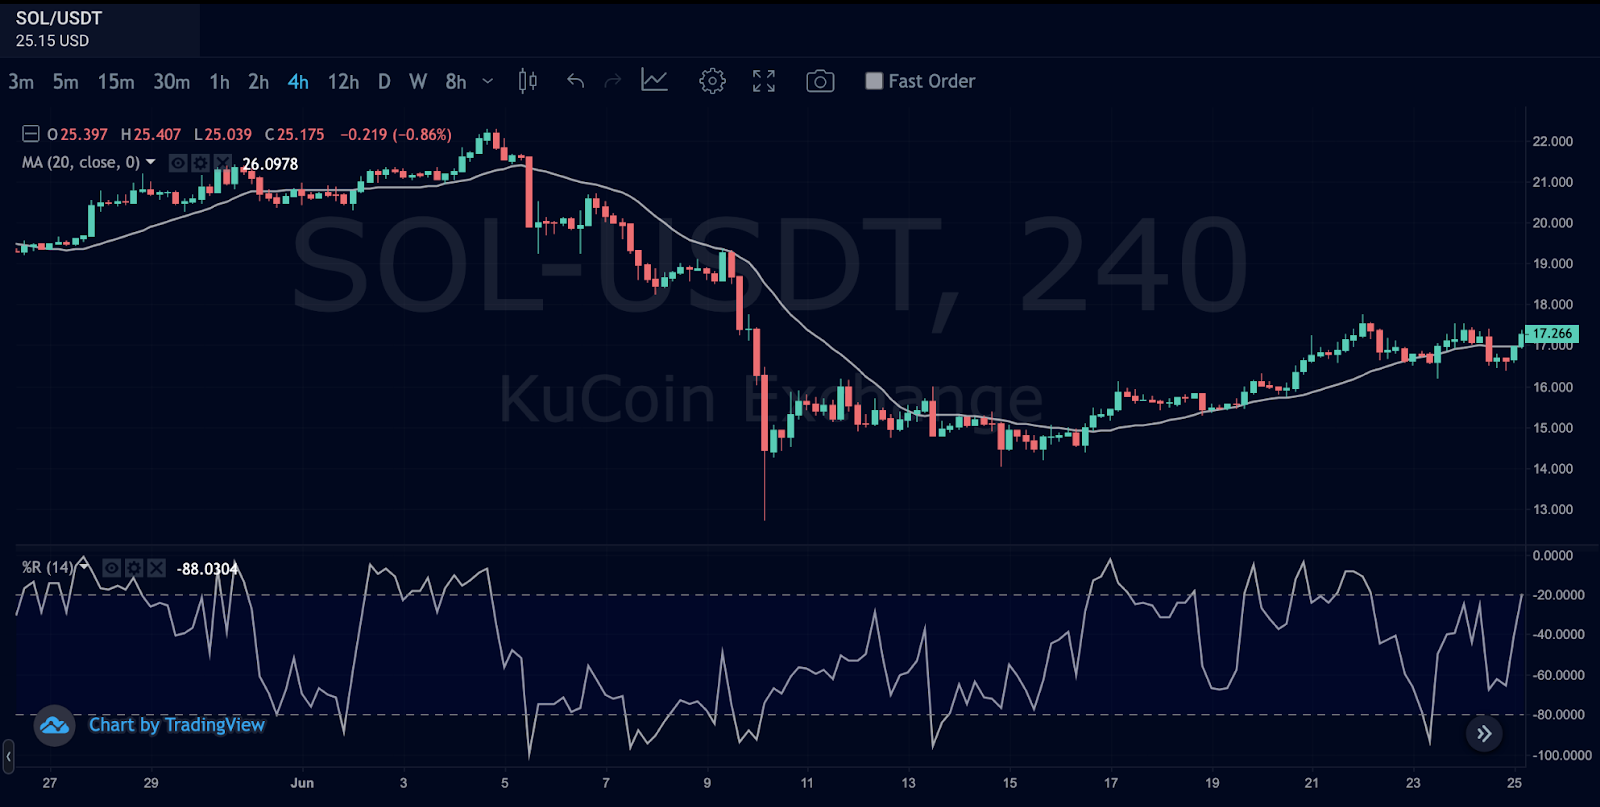
The above chart depicts the price movement of SOL/USDT from the KuCoin trading page. The 20-Day Simple Moving Average and the William %R were used. The White line that crosses the price candles represents the 20-D SMA. The 50 level, or the mid-point of the William %R indicator, is also a skewed line. We'll go over both short-term and long-term signal scenarios.
Case-1: Short-Signal
We can see the price of SOL/USDT dropping below the 20-day SMA and, at the same time, the value of William %R is also dropping below the 50 level or mid-point. So it is an excellent opportunity to open a short trade here.
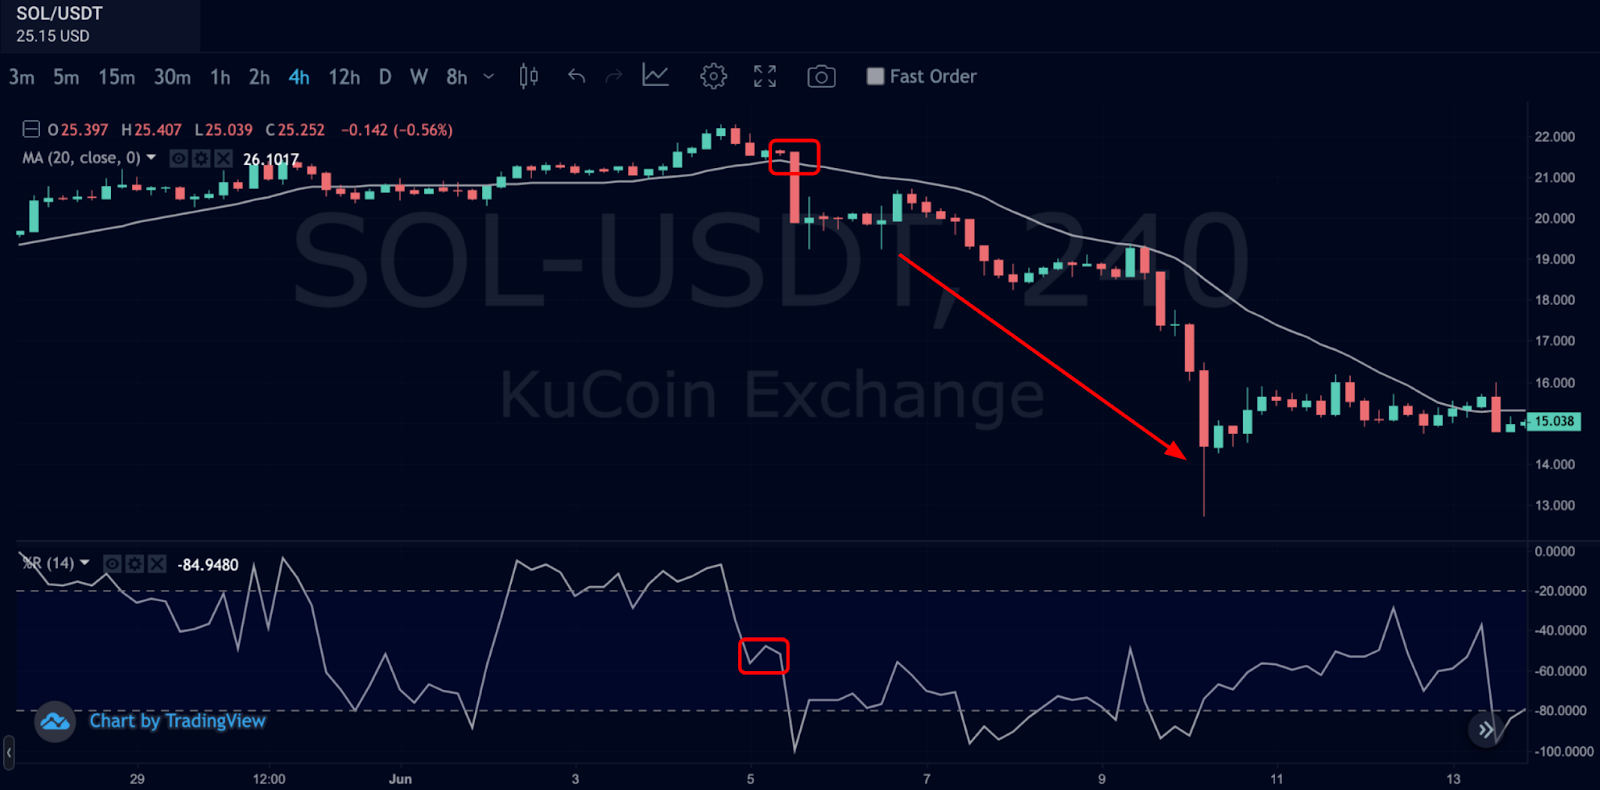
However, if the price falls below the 20-day simple moving average (SMA) or the Williams %R value rises above the 50 or midpoint level, we should continue to be short. We could have easily made a profit by exiting the trade when the %R indicator dropped below the midpoint level.
The above example is locating a short signal by combining %R and moving average. Let's look at a buy signal using the same strategy.
Case-2: Buy-Signal
In the Case-2 scenario, we can see that the price candles of SOL/USDT are crossing the 20-Days SMA line from below, while the William %R is already above the 50 level. In this case, a buying opportunity is on the way.

The William %R has been moving above the midpoint long. As a result, we can hold the position as long as the price crosses the 20-day moving average line from above or the William %R falls below the 50 level. That's how we can enter a buy trade in the cryptocurrency market using Williams %R and Moving average.
Advantages and Limitations of the Williams %R Indicator
One of the most visible advantages of the %R indicator is its bounded property. As a bounded oscillator, it's easy to read when an asset is approaching or settled at either end of the market. -20 shows an overbought market and -80 shows an oversold market.
On the other hand, readings on the indicator that are both overbought and oversold do not necessarily mean a reversal. Overbought readings actually aid in the confirmation of an uptrend because, according to the indicator, prices in a strong uptrend should frequently be pushing towards or beyond previous highs.
In contrast to downtrends, powerful uptrends may cause the market to see %R readings in an overbought zone for an extended period of time.
Pro tip: When trading using Williams %R, take into account that the indicator may also be overly sensitive, which causes it to send out a lot of false signals. For instance, the indicator can be in the oversold zone and start to rise, but the price doesn't follow suit.
This is due to the indicator's limited analysis of the previous 14 periods. Even when the price hasn't really changed over the course of a period, the present price's position in relation to the highs and lows in the lookback period varies over time. It’s best to use it in conjunction with price action tools and indicators.
Williams %R vs. Fast Stochastic Oscillator
The Williams %R determines the market's current level in relation to the lookback period's highest high. The fast Stochastic Oscillator, on the other hand, compares the current market level to the lowest low and oscillates between 0 and 100. Thus, these two oscillators effectively perform the same function and have a very similar visual appearance on charts.
|
Criteria |
Williams %R |
Fast Stochastic Oscillator |
|
Purpose |
Measures overbought and oversold market conditions. |
Measures overbought and oversold market conditions. |
|
Comparison Basis |
Determines the market's current level based on highest highs. |
Compares the current market level based on lowest lows. |
|
Range |
The output range is 0 (bullish market) to -100 (bearish market). |
The output range is 0 (bearish market) to +100 (bullish market). |
|
Interpretation |
Levels > -20 are generally considered overbought, and levels < -80 are considered oversold. |
Levels < 80 are generally considered overbought, and levels > 20 are considered oversold. |
|
Multiplier |
The multiplier is -1, thus resulting in a negative output range. |
The multiplier is +1, thus resulting in a positive output range. |
These two formulations appear extremely similar at first glance, but they actually have two key distinctions. The first distinction is that fast stochastic compares using recent lows, whereas %R compares using recent highs, as we've already covered.
The multiplier is the second key distinction. The rapid stochastic oscillator has a range of 0 to +100, whereas the %R has a limited output range of 0 to -100.
What To Keep In Mind While Using The Williams %R Indicator
It's crucial to keep in mind that overbought or oversold signals on the Williams %R do not always predict a market's general trend reversing. An oversold indication could indicate that the underlying market price is close to its prior lows, while an overbought signal could indicate that it is towards the highs of its previous range.
Conclusion
Williams %R is an excellent technical tool for identifying overbought and oversold zones in a cryptocurrency. The Williams %R produces stronger and more efficient signals than traditional indicators. Even though %R signals are more reliable, traders should still be cautious and confirm these signals with other technical indicators to avoid mishaps or misleading signals.
For traders, these technical indicators can only suggest what price history sometimes predicts. It doesn't exempt them from producing false signals too. That's why both fundamentals and technicals influence the crypto price. Therefore, Williams %R should be used with other technical indicators such as moving Averages, Candlestick analysis, trend lines, or Fibonacci.
Did you find this lesson useful and interesting? Follow KuCoin Learn for more amazing educational content. All the best!
Disclaimer: The information on this page may come from third parties and does not necessarily reflect KuCoin’s views. It is provided for general reference only and should not be interpreted as financial or investment advice.
Virtual asset investments may involve risk. Please carefully assess the product risks and your own risk tolerance. For more information, please refer to our Terms of Use and Risk Disclosure.