Dow Theory in Crypto Trading: Comprehensive Guide

Dow Theory is a set of principles that can help understand market cycles. This article will cover the Dow Theory in cryptocurrency and how to trade it.
Technical analysis has advanced significantly in the modern era. Some investors, however, prefer traditional strategies, and the Dow Theory is one of the oldest and most well-known schools of technical analysis. The inspiration came from Charles Dow's collected works, as he had published his views in the Wall Street Journal more than 150 years ago, in the early 1900s.
While Dow did not express his ideas in the form of a theory, other authors, most notably William Hamilton, compiled and improved on his ideas to form the Theory of Relativity after his passing. Dow Theory is now one of the fundamental concepts in the technical analysis used in financial markets such as the current cryptocurrency market.
Overall, the Dow Theory that we see in the current market was created by many individuals over its long and rich history of more than 100 years. However, this concept is still relevant today in trading cryptocurrencies and their derivatives.
This article will deconstruct the Dow Theory and explain the various market stages using Dow's work as a foundation. Finally, we'll review some practical Dow Theory-based chart reading strategies investors can use to trade cryptocurrency assets.
What Is Dow Theory?
According to Dow, the stock market as a whole is an accurate indicator of the direction of the economy's business conditions. Furthermore, by examining the entire market, one can effectively assess the circumstances surrounding it, determine the direction of significant market trends, and predict the expected movement of specific stocks.
The market is in an uptrend if one of its averages rises above a prior significant high, followed by a comparable rise in the other average. For instance, if the Dow Jones Industrial Average (DJIA) reaches an extreme high, the Dow Jones Transportation Average (DJTA) will do the same in a short period.
Using the Dow Theory, the DJIA and DJTA indices movement predict the direction of the trend. A bullish trend exists when the two indices move in tandem, resulting in a string of higher lows followed by continuously higher highs.
Of course, the Dow theory is not limited to stock markets — traders have used it successfully in other markets like crypto for years.
How Does the Dow Theory Work?
The Dow Theory is a set of guidelines investors can use to frame the market. These six fundamentals could help investors make more precise investment decisions in optimistic and pessimistic markets.
1. Asset Prices Reflect News Updates
This theory is based on the efficient markets hypothesis, which states that the asset's current price will reflect all information available to the public. It implies that even if a person does not research related market information, the coin will follow the sentiment from the most recent news.
This is undoubtedly the Dow theory's most contentious assertion. Investors must forecast future success or failure using both reactive and proactive data, and there is no way to know for sure if the prices reflected are proactive or reactive in character — that is, if the market is already aware of the information or if it is merely reacting to the news.
Regardless, there is no guarantee that the market will reflect the mood of recent news events.
For instance, during a conference call on July 15th, core Ethereum developer Tim Beiko, who leads core protocol meetings, proposed September 19 as a potential goal date for the merger. This news causes the price of ETH to skyrocket that day. Likewise, Ethereum 2.0 Merge is keeping the Ether price supported.

Ethereum Developers Confirms The Perpetual Date For The Merge
2. Three Main Types of Market Trends
Dow has classified trends into three categories based on how long they have lasted:
- Primary Trends: The primary trend is the market's main trend, demonstrating the market's long-term direction and may last for years.
- Secondary Trends: Secondary trends are reversals of a primary trend. It resembles a movement that is opposed to the dominant trend. If the primary trend is bullish and rising, the secondary trend will most likely be bearish. These patterns can last anywhere from three weeks to three months.
- Minor Trends: Minor trends are changes in the market's movement from day to day. These trends are short-lived (less than three weeks) and move in the opposite direction as the secondary trend. Minor trends, according to some experts, reflect market speculation.
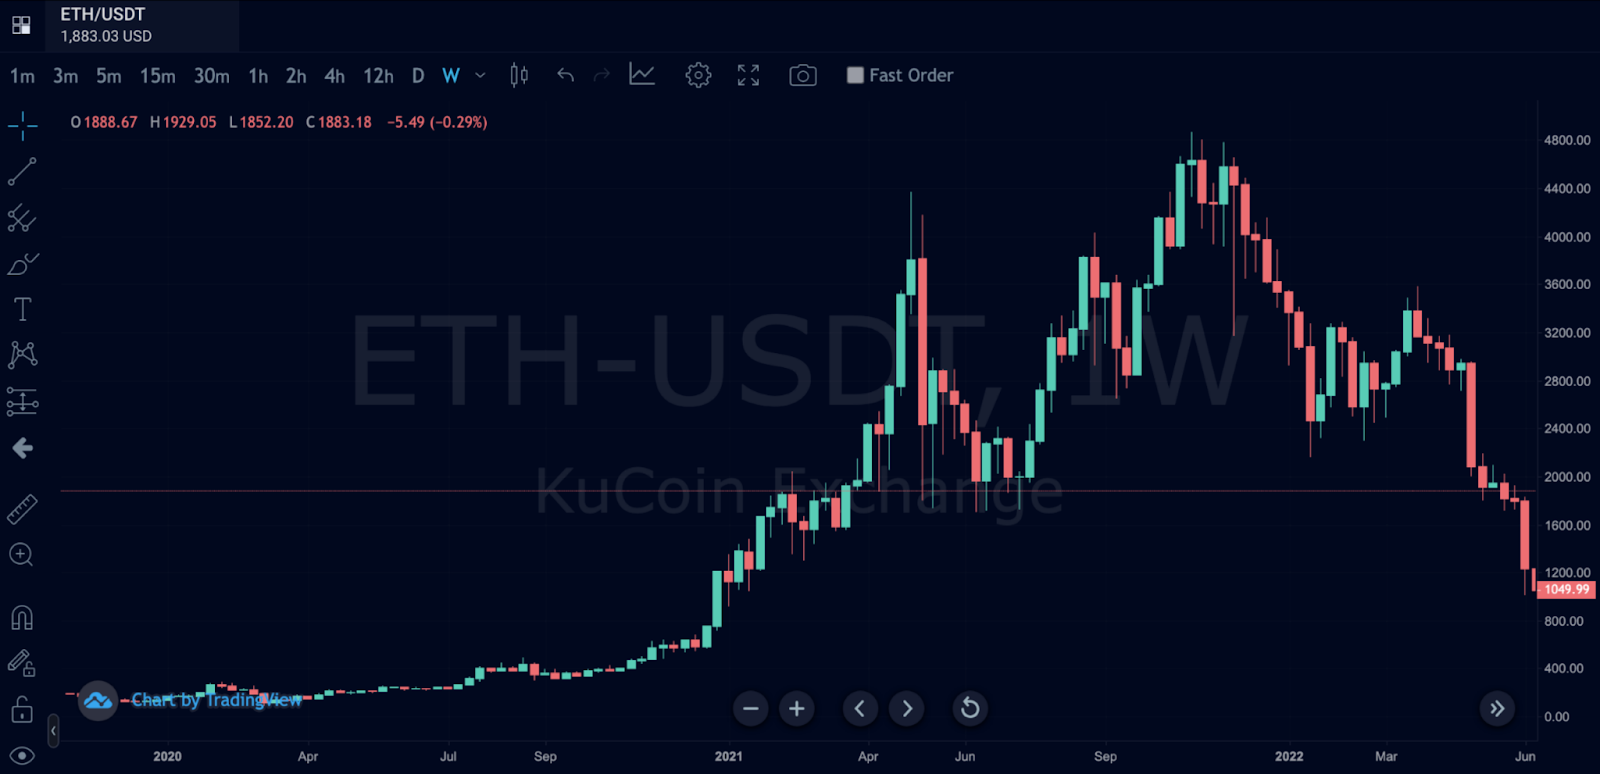
In the above chart, The primary trend is marked with 1, the secondary trend with 2, and the minor trend with 3.

Weekly ETH/USDT Chart with a Bullish Primary Trend
3. Primary Trend Has Three Phases
According to the Theory, a primary trend will go through three phases.
- The Accumulation Phase: The accumulation phase of a bull or bear market marks the beginning of the rising or falling trend. In this case, traders enter the market to buy or sell assets against the general market sentiment.
- Public Participation: As the market situation improves and the positive mood grows stronger, more investors enter the market during the public participation phase. As a result, market prices increase or decrease.
- The Panic Phase: Investors engage in excessive buying during the panic phase. Many traders try to increase their profits through speculation, but early adopters notice that the trend is fading and exit the position.
4. Trends Continue Until a Prominent Reversal Occurs
Primary trend reversals can be confused with secondary trend reversals. The theory encourages patience, requesting that a potential reversal be demonstrated. It is difficult to determine whether a price increase in a bear market represents a reversal or a brief recovery followed by even lower lows.
Trend Reversal on the ETH/USDT Chart
According to the Dow Theory, primary trends will result in continued brief noise moving in the opposite direction. Trends will continue as long as there are no obvious signs of a reversal. An ETH/USDT weekly chart, shown above, shows how the price is still rising despite a 30% sell-off due to a strong uptrend.
It demonstrates the concept of opening a trading position in the direction of the primary trend and avoiding any opportunity to trade against it.
5. Indices Must Confirm Trends
Charles Dow believed that a trend in another market must support a trend detected in one market's average. If a trend appears in one market index but differs from any other market average, it is likely just noise. The underlying idea behind this thinking is a potential link between the indices derived from producing and selling goods.
Shipping physical goods from warehouses, for example, necessitates transportation. As a result of the decline in transportation stock, industrial stock prices will fall. Thus, the transport and industrial averages should ideally move in tandem to indicate a consistent market attitude. A divergence occurs when one of the indexes rises while the other falls. It could be an indication that the current market trend will change.
Investors can forecast the direction of the cryptocurrency market by comparing it to other indices such as the S&P 500, FTSE, or NASDAQ.
6. Volume Is Required to Verify a Trend
If the market is moving in the primary trend direction, the volume should rise; if it is moving against it, the volume should fall. Low volume indicates a weakening trend. In a bull market, the volume should increase as prices rise and decrease during successive pullbacks.

Volume Trend Verification on the ETH/USDT Weekly Chart
The above price chart #1 represents the primary trend, and #2 represents the increase in volume. It demonstrates that the volume is following the primary trend.
Tips for Applying Dow Theory in Crypto Trading
Aside from the six tenets of the Dow Theory discussed above, there are also three considerations to help you better maximize the application of the Dow Theory. They are, closing prices and narrow ranges, trend identification, and reversals.
Closing Prices and Narrow Ranges
The Dow Theory focuses only on closing prices and neglects price movements within the day or active market hours. There's also the concept of narrow ranges or sideway ranges where the price of an asset moves within a horizontal frame, and we cannot detect a clear trend. Deciding on a market trend within a narrow range can be fatal, and a range shows traders’ indecision. It is always advisable to wait for a clear breakout at either end of the range to establish where the market is going.
Trend Identification
The Dow Theory is largely used to identify a market trend. Therefore, it is important to know how to spot the beginning of a trend or a reversal. In Dow Theory, the peak-and-trough analysis is a major way to identify a market reversal. You may know it as highs and lows. Higher highs (peaks) and higher lows (troughs) often signify an uptrend, while lower highs and lower lows signify a downtrend.
Reversals
We've already discussed the primary trends and trend identification. When the market fails to follow through with successive peaks and troughs as previously created in line with the primary trend, a trend reversal might be in play.
However, you should note that a primary trend reversal can take weeks and months to become glaring. So, you don't want to jump in the opposite direction of the market till it clearly establishes through patterns and analysis that it is headed in that direction.
How to Apply Dow Theory in Crypto Markets
1. Primary and Secondary Trends
Let's apply Dow Theory to the cryptocurrency market to determine a profitable price trend. Identifying the primary trend is the first step for investors. Because the crypto market is still relatively new compared to the traditional markets, it is less difficult to identify the primary trend.

Primary and Secondary Trend Example
The above weekly ETH/USDT chart shows a bullish primary price trend (represented by number 1) and a bearish secondary price trend (represented by number 2). The third arrow (3) is the entry point.
The graph shows how the price drops during the second wave but immediately recovers after surpassing the most recent upward swing. As a result, the price surges upward under sudden bullish pressure.
According to the Dow Theory, traders should only place trades aligned with the primary trend. In this scenario, investors should watch for the end of the secondary trend. The graph shows the bearish secondary trend will end when the price rises above the most recent swing high.
2. Accumulation and Distribution
Investors must also have the accumulation and distribution phases supported by volume indicators for a more precise trading entry. The following confirmations determine the buy entry in the daily ETH/USD chart below.

Accumulation and Distribution Example
#1 & #3 represents accumulation, #2 represents distribution, while #4 is the entry point.
We can observe:
-
The primary trend continues to rise.
-
Volume is generally beneficial to the primary trend.
-
After completing the distribution phase, the market entered the accumulation stage.
-
In this accumulation zone, the secondary trend is bearish and is being reversed by a second swing high.
Limitations of Dow Theory
Even though Dow Theory is the foundation of modern technical analysis, it has limitations.
-
The criteria for identifying a trend shift are overly detailed.
-
If you consider only closing prices when assessing the market, there is sometimes an overemphasis on minor price movements.
-
Predicting market trends using supply and demand requires at least two years of data.
-
This theory holds that we cannot predict market trends in advance.
-
This theory falls short of accurately describing the scope of buyers and sellers.
-
Dow Theory cannot account for the target levels.
-
According to Dow Theory, there is a lag between the actual turn of a major trend and its recognition.
-
The hypothesis does not notice a turn until it has already occurred and been confirmed.
Conclusion
Even though it is over a century old, the Dow Theory still holds in today's trading market. Because understanding this theory can help traders identify and capitalize on market movements. This novel concept makes it difficult to connect multiple indices regularly.
Investors may, however, combine price movements of comparable assets, such as Bitcoin and Ethereum, to gauge the market. Even experienced cryptocurrency traders require a proper trading strategy. The cryptocurrency market is highly volatile. Investors would be wise to remain skeptical even if they invest resources using essential money management procedures.
This is why it’s imperative to combine the knowledge of technical analysis, fundamental analysis, and sentiment analysis, in order to gauge the state of the market.
Disclaimer: The information on this page may come from third parties and does not necessarily reflect KuCoin’s views. It is provided for general reference only and should not be interpreted as financial or investment advice.
Virtual asset investments may involve risk. Please carefully assess the product risks and your own risk tolerance. For more information, please refer to our Terms of Use and Risk Disclosure.