


Author: Coingecko
Compiled by: Felix, PANews
After a turbulent end to 2025, Bitcoin continued its volatile decline at the start of 2026. Meanwhile, geopolitical and macroeconomic events have driven increases in the prices of gold, silver, and recently, crude oil. As cryptocurrency continues to gain mainstream acceptance as an asset class, many Wall Street investors may be experiencing their first crypto bear market. Coingecko examined how cryptocurrencies performed relative to other traditional asset classes at the start of 2026.
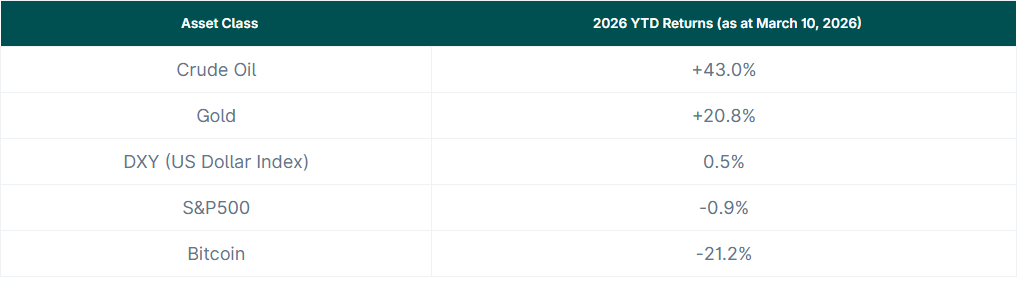
With the outbreak of the Iran war, crude oil prices rose faster in 2026 than any other asset class.
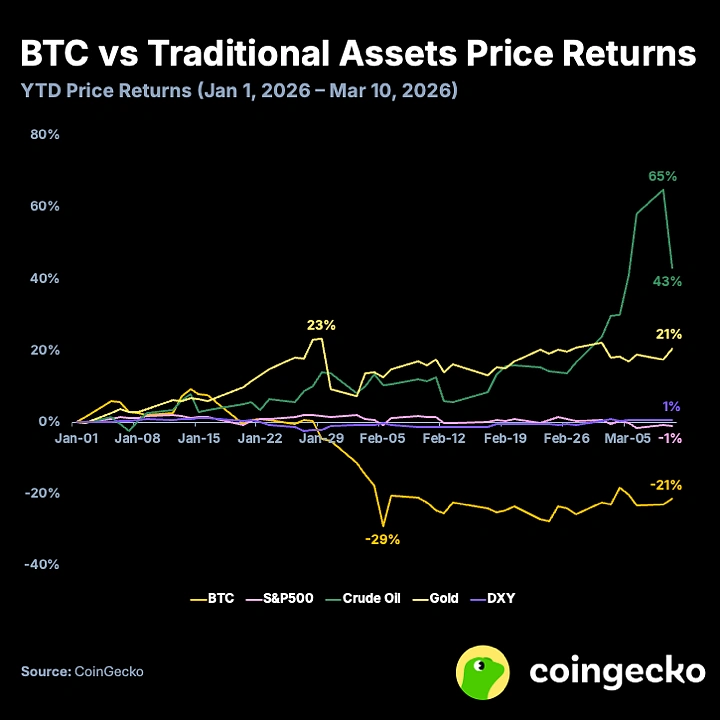
Since early 2026, crude oil prices have been gradually rising due to escalating tensions in the Middle East and supply shortages in key markets. However, the situation reached a peak on February 28, when the United States and Israel launched their latest attack on Iran. Crude oil prices surged intraday to as high as $119.48, compared to just $57.41 at the start of the year.
Meanwhile, Bitcoin’s price continued to decline in 2026, becoming the worst-performing asset class to date. However, since early March, Bitcoin appears to have found support between $65,000 and $75,000, after falling to a low of $62,800 in early February. U.S. spot Bitcoin ETFs have seen strong inflows since late February (net inflows of $1.9 billion since February 20, though still a net outflow of $8.289 billion year-to-date), while Strategy has maintained its consistent buying pace, investing $5.6 billion since the start of the year.
Since 2026, cryptocurrencies have shown only moderate correlation with the S&P 500 and gold, perhaps signaling that asset classes are finally beginning to "decouple."
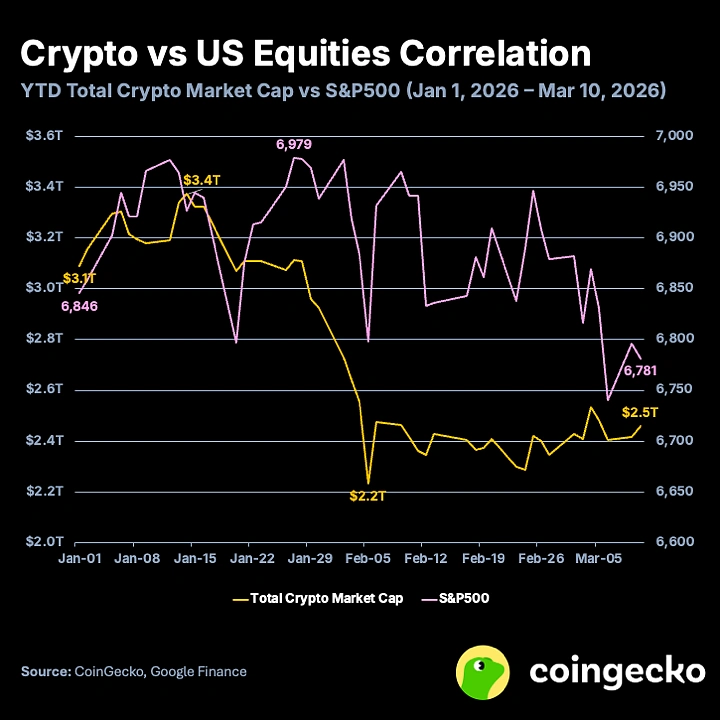
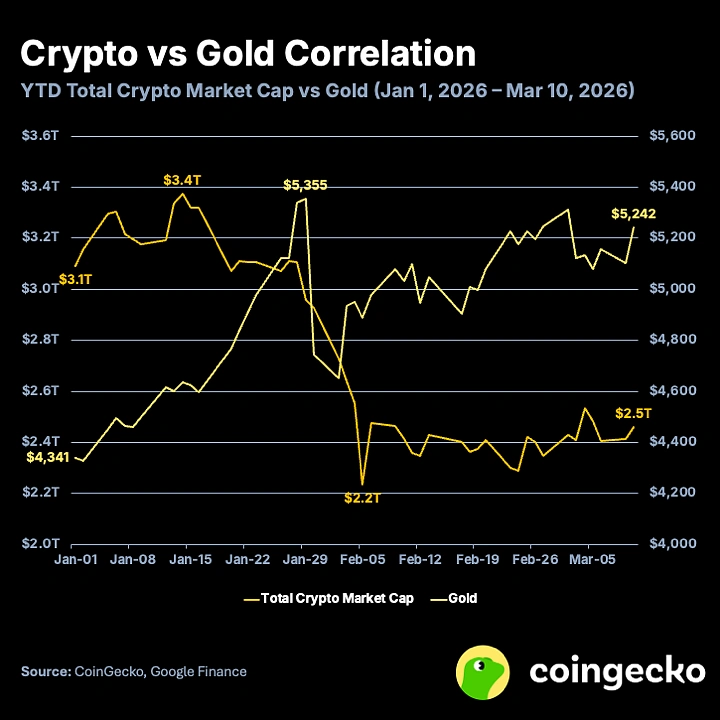
Since the beginning of the year, the correlation between the total cryptocurrency market cap and the S&P 500 has been 0.49, indicating a moderate positive correlation, similar to 2025 (when the annual correlation was 0.46). On the other hand, the year-to-date correlation between cryptocurrency and gold has turned to -0.69, indicating a moderate negative correlation. In 2025, the correlation between cryptocurrency and gold was only 0.19, showing weak or no correlation. Overall, cryptocurrency as an asset class is moving away from its long-standing perception as a pure risk asset, as it is decoupling from U.S. equities.
U.S. equities, as represented by the S&P 500, face significant headwinds in 2026. Despite growing investments in AI and generally strong economic and earnings data, the index has actually declined since the beginning of the year. Geopolitical tensions have undoubtedly played a role, but ongoing uncertainty about AI’s impact on the future economy and labor market has fueled the “SaaS doomsday” narrative. Since the start of the year, the market capitalization of publicly traded software and SaaS companies has evaporated by $1.3 to $1.5 trillion, accompanied by sharp declines in forward price-to-earnings ratios and revenue multiples.
In addition, gold has continued its strong momentum since 2024, with a year-to-date gain of over 20%. Gold is typically viewed as a stable store of value and a safe-haven asset, but due to its sharp price rise, it is currently exhibiting higher volatility. Ongoing geopolitical and macroeconomic pressures continue to drive its upward momentum, with both retail traders and sovereign nations actively purchasing.
Related reading: BTC Options Insight: Why is March 20 a critical node for volatility turning point?
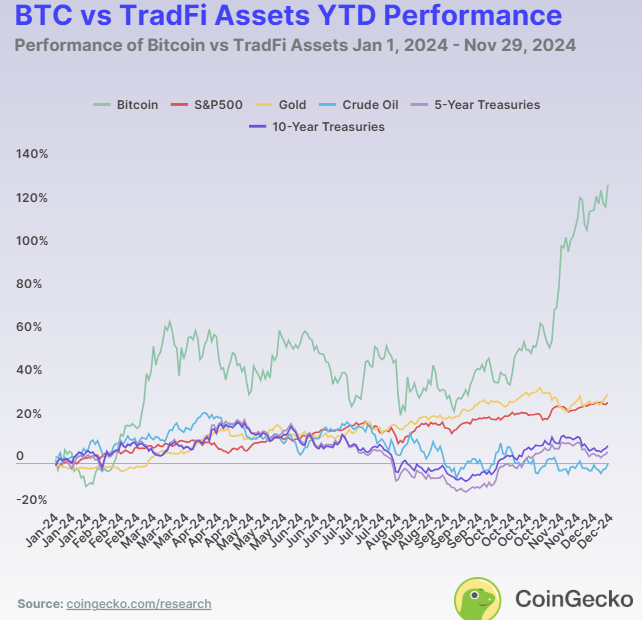
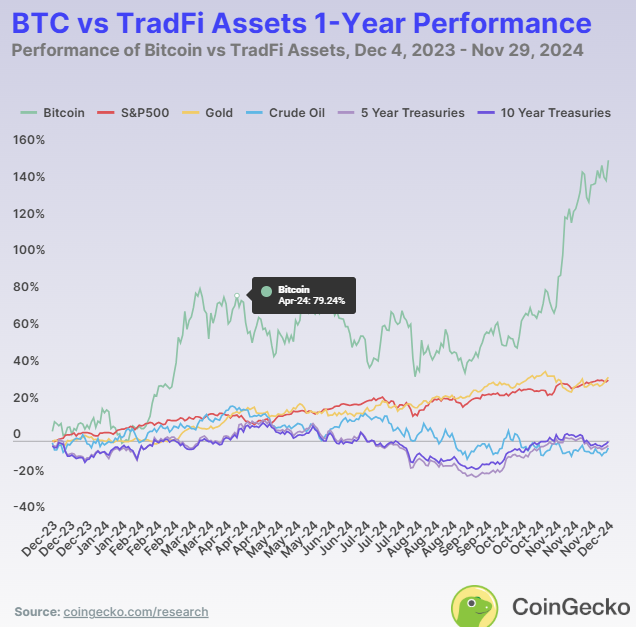
Performance in 2026 will be markedly different from that of 2024; for reference, below is the performance of Bitcoin and other asset classes in 2024 (published December 2024).
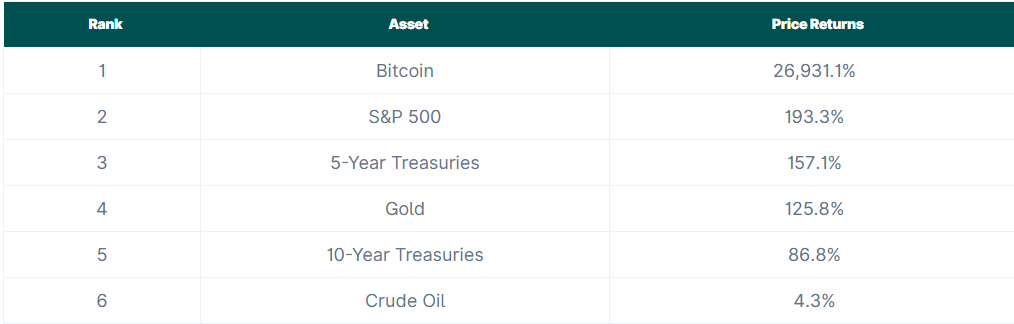
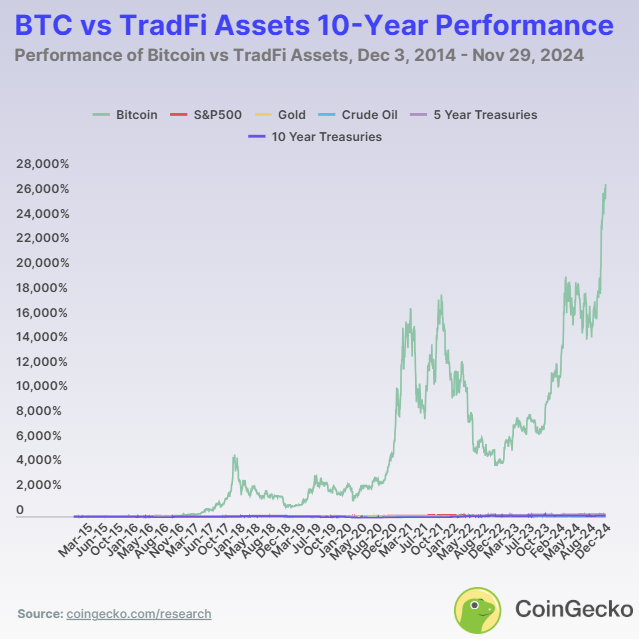
Bitcoin, often dubbed the "magic internet money," may have become a legitimate investment asset alongside traditional assets such as stocks, commodities, and bonds. Over a 10-year period, Bitcoin has delivered an astonishing return of 26,931.1%. Imagine that $100 invested in 2014 would now be worth $26,931.10. While these figures are remarkable, it is equally important to examine its performance relative to other assets over both short- and long-term horizons.
Which asset has performed best over the time frames of year-to-date, 1 year, 3 years, 5 years, and 10 years?
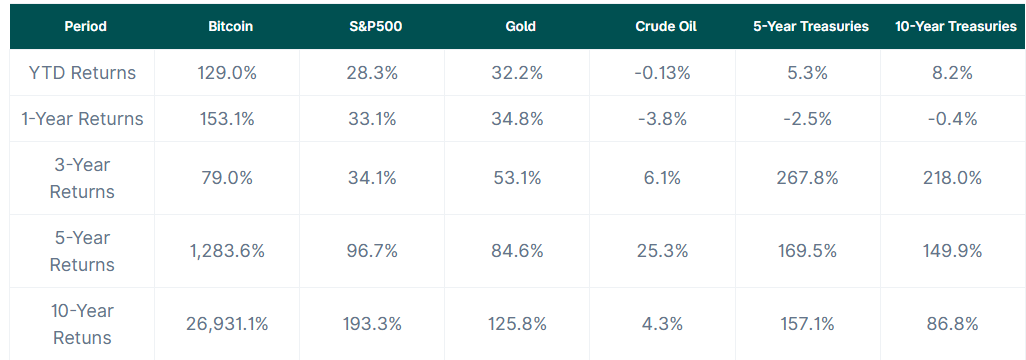
Performance across different time horizons reveals the strengths and weaknesses of each asset. In 2024, Bitcoin was the top-performing asset, with a return of 129.0%. Gold followed closely, delivering a year-to-date return of 32.2%, demonstrating its reliability as a traditional store of value. The S&P 500 remained strong, with a return of 28.3%. However, crude oil prices declined, resulting in a return of -0.13%, while U.S. Treasuries delivered modest returns: 5.3% for the 5-year note and slightly higher at 8.2% for the 10-year note.
Over a one-year period, Bitcoin has continued to outperform other assets, delivering a return of 153.1%. Gold returned 34.8%, followed by the S&P 500 at 33.1%. The strong performance of these three asset classes reflects market stability over the past year. However, government bonds have been more sensitive to economic shifts, with 5-year and 10-year bonds returning -4.3% and -2.6%, respectively. These figures illustrate how bonds fluctuate in response to interest rates and fiscal policy.
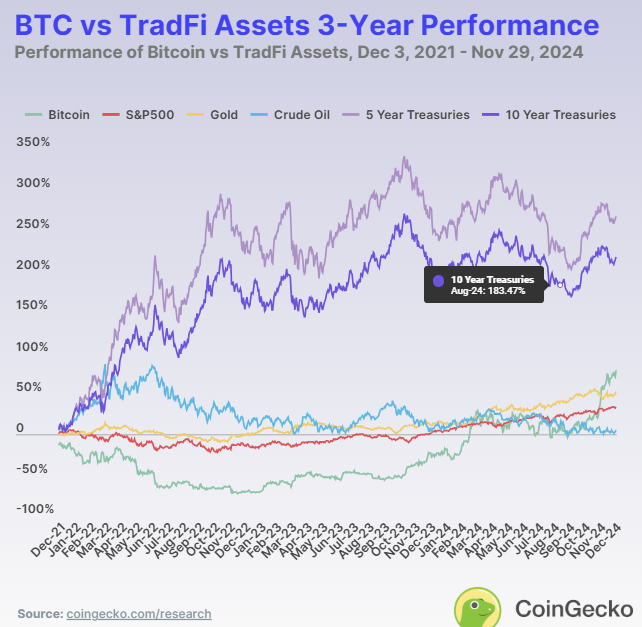
Over the three-year period, the market performance landscape has shifted, with bonds gaining favor as economic stability has become more important. U.S. Treasuries led the way, with 5-year yields reaching 267.8% and 10-year yields following closely at 218%. Bitcoin also performed strongly during the same period, delivering a return of 79%, while gold secured second place with a solid return of 53.1%, offering a degree of safety amid market uncertainty. Crude oil was the only asset underperforming relative to others during this period, with a return of just 6.1%.
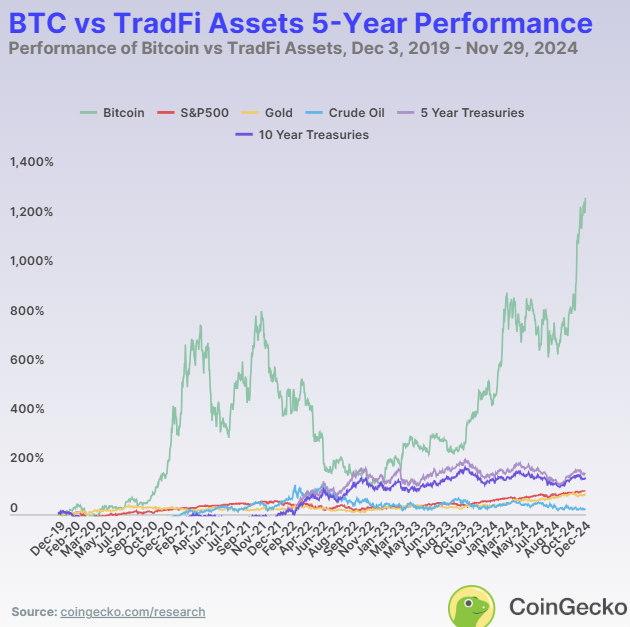
Over a five-year period, Bitcoin demonstrated the strongest performance with a return of 1283.6%. The S&P 500 and gold remained stable, returning 96.7% and 84.6% respectively. U.S. Treasuries also performed well, with five-year yields at 157.1% and ten-year yields at 149.9%. Crude oil prices rose only 25.3%, indicating relatively lower long-term investment appeal. This period’s data suggests that Bitcoin offers substantial potential returns for medium-term investments, while the steady growth of stocks and gold provides balance.
Over a decade-long period, Bitcoin’s growth rate of 26,931.1% far surpasses all other assets, demonstrating its immense investment potential for early adopters. While other assets have delivered significantly lower returns, they still offer steady gains—for example, the S&P 500 returned 193.3%, and gold returned 125.8%. U.S. Treasuries have also preserved value, with five-year Treasuries returning 157.1% and ten-year Treasuries returning 86.8%. In contrast, crude oil returned only 4.3%, significantly underperforming compared to other assets.
Observations over the past decade have shown that Bitcoin is the ultimate high-growth asset, while gold, bonds, and stocks offer safer, lower-return alternatives for risk-averse investors. However, Bitcoin was still a relatively new asset at the time, with a market capitalization far smaller than that of other assets. It was precisely due to its smaller base that it was able to grow at a faster rate.
Has Bitcoin been highly volatile over the past decade?
Over the past decade, Bitcoin's substantial price gains have been accompanied by significant volatility. Bitcoin's price has dropped as low as $172.15 and reached as high as $103,679. The chart below clearly illustrates Bitcoin's cycles, which coincidentally occur every four years following a halving event. Over this decade, Bitcoin has experienced two "bull market" cycles, in 2017–2018 and 2020–2021, and is currently in the midst of one such cycle. At the end of each cycle, Bitcoin's price typically plunges by more than 70% from its peak, highlighting its high volatility. This extreme volatility underscores Bitcoin's high-risk, high-reward nature, making it highly attractive to growth-oriented investors but challenging for those seeking stability.
Is Bitcoin's performance correlated with other assets?
Beyond volatility, Bitcoin’s relationship with other major assets such as the S&P 500 Index and gold can further reveal its unique behavior. Correlation analysis shows how Bitcoin moves in sync with or diverges from traditional markets:
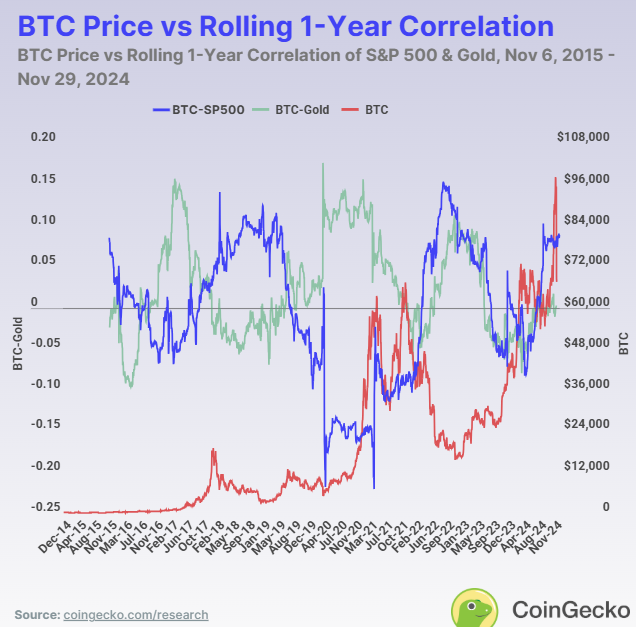
Bitcoin and the S&P 500 Index
For many years, Bitcoin's correlation with the S&P 500 index (shown in blue) was unstable and typically close to zero before 2018. This low correlation indicated that, during this period, Bitcoin’s behavior was largely independent of the stock market. However, since 2020, this correlation has strengthened, with Bitcoin’s price movements becoming more aligned with stocks during major economic events such as the COVID-19 pandemic. The price correlation also coincides with Bitcoin’s rallies in 2018, 2020, and 2024.
Bitcoin and Gold
In terms of gold, Bitcoin’s correlation with gold is inversely related to its correlation with the S&P 500. This suggests that, although both are considered alternative investments, Bitcoin and gold (shown by the green line) typically move independently of each other. Additionally, the correlation moves inversely with Bitcoin’s price: when the price rises, correlation decreases, and vice versa. This indicates that when Bitcoin underperforms, investors tend to shift toward gold. However, during macroeconomic events, correlation often experiences brief spikes, reflecting both assets’ responses to similar market conditions. Nevertheless, Bitcoin has not yet fully established itself as “digital gold.”
The following is a comparison of the 10-year price returns between Bitcoin and traditional assets: