


The Golden Cross in 2026: 50/200 MA Weekly Chart Strategy
2026/02/11 06:57:02
Key Takeaways
-
Macro Precision: The weekly 50/200 MA crossover is a rare but high-conviction signal that often precedes multi-year market cycles.
-
Lagging vs. Leading: While the Golden Cross / Death Cross is a lagging indicator, its appearance on a weekly chart confirms that a trend shift is structurally supported by high-volume capital.
-
Filtering the Noise: Weekly charts eliminate the "whipsaws" common in daily timeframes, providing a clearer path for position traders.
-
KuCoin Infrastructure: Utilizing the advanced charting tools on KuCoin allows traders to overlay these critical MAs and set alerts for structural pivots.
In the ever-shifting landscape of digital assets, 2026 has proven that while technology evolves, the fundamental laws of market psychology remain constant. For long-term investors and macro strategists, few signals carry as much weight as the interaction between long-term moving averages. Specifically, The "Golden Cross" 2026: Evaluating 50/200 MAs on weekly charts has emerged as the definitive signal for distinguishing between a temporary "relief rally" and a structural bull market.
While the daily chart provides the "noise" of immediate sentiment, the weekly timeframe offers the "signal" of institutional conviction.
-
Defining the Macro Compass: 50/200 MAs in 2026
The interaction between the 50-period Simple Moving Average (SMA) and the 200-period SMA is widely regarded as the ultimate trend barometer. In 2026, where algorithmic trading dominates, these levels act as "Psychological Magnet Zones" where massive limit orders are clustered.
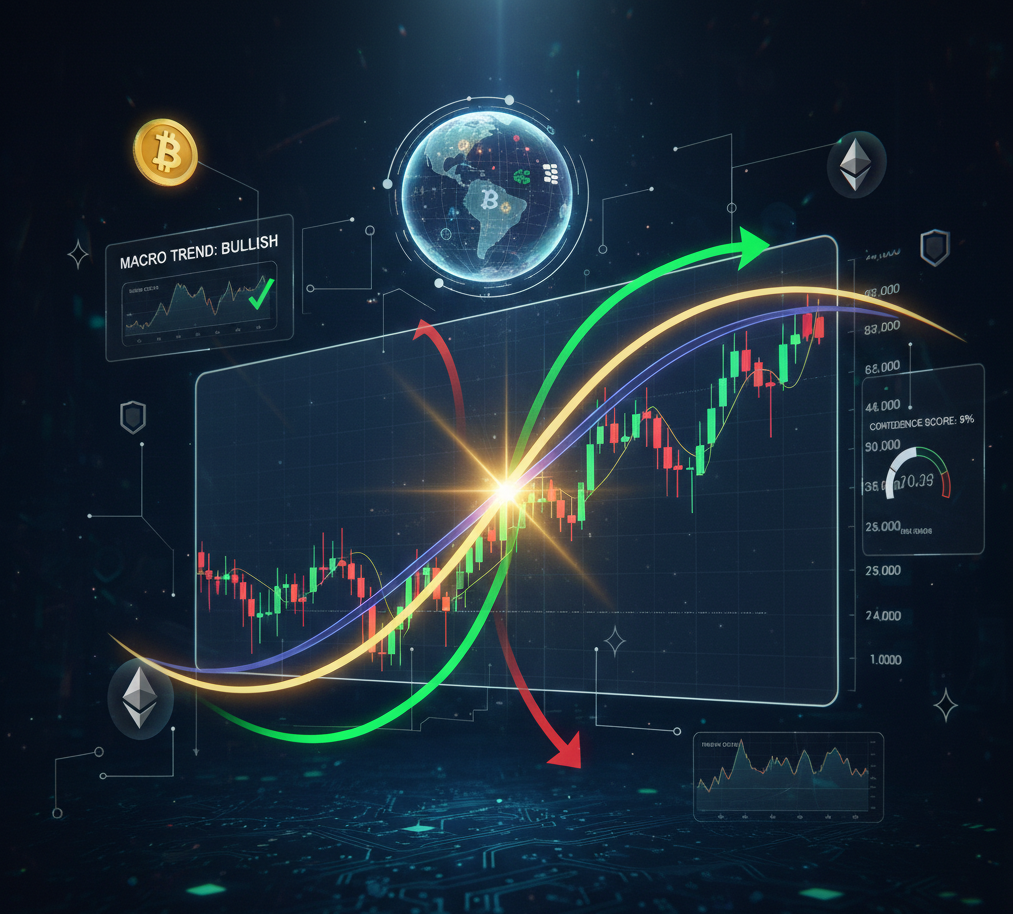
The Golden Cross (The Bullish Pivot)
A Golden Cross occurs when the faster-moving 50-period MA crosses above the slower 200-period MA. On a weekly chart, this suggests that the average price of the last year (50 weeks) has officially surpassed the average price of nearly four years (200 weeks). This is a monumental shift in momentum that typically signals the transition into a "Markup Phase."
The Death Cross (The Bearish Warning)
Conversely, a Death Cross forms when the 50-period MA falls below the 200-period MA. As highlighted in recent KuCoin Blog technical reviews, a weekly Death Cross is often the precursor to a deep "Crypto Winter" or a prolonged deleveraging event. It indicates that the intermediate-term price action has become weaker than the long-term trend, suggesting structural exhaustion.
-
Why the Weekly Timeframe is King in 2026
In 2026, market participants are bombarded with information. High-frequency bots can create "fake" Golden Crosses on the 15-minute or even 1-hour charts to trap retail traders. This is why The "Golden Cross" 2026: Evaluating 50/200 MAs on weekly charts is so critical for serious investors.
The Power of "Time Smoothing"
-
Reliability: A weekly crossover requires months of sustained price action to form. It cannot be easily manipulated by a single whale or a flash-crash event.
-
Institutional Alignment: Large hedge funds and sovereign wealth funds often use the weekly 200-MA as their "Line in the Sand" for entry and exit. When the 50-MA crosses it, it triggers automated rebalancing across the industry.
-
Clarity on KuCoin Markets: By viewing KuCoin Markets data through a weekly lens, you can see the "forest" instead of just the "trees," allowing for more relaxed and disciplined portfolio management.
-
Trading the Signal: A 2026 Tactical Guide
Identifying the Golden Cross / Death Cross is only the first step. Execution requires a nuanced approach to avoid "chasing" the breakout.
The "Backtest and Bounce" Strategy
Once a Golden Cross is confirmed on the weekly chart, the price often enters a parabolic phase before retracing. The professional entry is not at the cross itself, but during the "backtest" where the price returns to touch the 50-week MA as support.
-
Spot the Cross: Identify the 50-week MA trending toward the 200-week MA on the KuCoin platform.
-
Monitor Volume: A valid Golden Cross must be accompanied by rising volume on KuCoin Markets.
-
Set Alerts: Use the KuCoin Lite version to set price alerts near the 50-week SMA. This allows you to stay informed without being glued to the screen.
-
Confirm the Bounce: Wait for a bullish candlestick pattern (like a Hammer or Engulfing) on the 50-week MA before entering your long position.
Stay updated on any major delistings or liquidity shifts by checking the official KuCoin announcements, as these fundamental changes can occasionally override technical signals.
Conclusion: The Ultimate Filter for Your Portfolio
In the hyper-active world of 2026, The "Golden Cross" 2026: Evaluating 50/200 MAs on weekly charts serves as a vital anchor. It transforms technical analysis from a guessing game into a statistical edge. By focusing on these macro crossovers and ignoring the daily noise, you align your strategy with the long-term flow of institutional capital. Whether you are navigating a Golden Cross or Death Cross, the key to success remains the same: discipline, patience, and the right trading partner like KuCoin.
FAQs for “The Weekly Golden Cross”
Is a weekly Golden Cross a 100% guarantee of a bull market?
No technical indicator is 100% certain. However, a weekly Golden Cross is historically one of the most reliable signals for trend continuation. It should always be used alongside other indicators like the RSI and volume analysis on KuCoin Markets.
How long does a weekly Golden Cross typically last?
Once formed, a weekly Golden Cross can define a trend that lasts anywhere from several months to several years. In the 2026 cycle, these signals have been particularly effective at identifying the start of major ecosystem expansions.
What is the difference between SMA and EMA for the 50/200 cross?
The Simple Moving Average (SMA) is the industry standard for the 50/200 cross because it is what institutional traders watch. The Exponential Moving Average (EMA) reacts faster to price changes but can produce more "false signals" on lower timeframes.
Should I trade Death Cross on the weekly chart?
A weekly Death Cross is a serious bearish signal. Most long-term investors use it as a signal to move to stablecoins or hedge their positions. You can find detailed hedging strategies on the KuCoin Blog.
Can the KuCoin Lite version show these MAs?
The KuCoin Lite version is optimized for quick trades and price monitoring. For the detailed technical drawing of 50/200 SMAs on weekly charts, using the Pro charting features on KuCoin is the best approach.
Strategize with the Macro Trend
-
Manage Your Long-Term Portfolio: Sign in to KuCoin
-
Analyze Historical MA Crossovers: KuCoin Markets Deep Charts
-
Explore Trend-Following Tactics: Visit KuCoin Blog
-
Stay Informed on Market News: Official KuCoin Announcements